Humana 2007 Annual Report Download - page 88
Download and view the complete annual report
Please find page 88 of the 2007 Humana annual report below. You can navigate through the pages in the report by either clicking on the pages listed below, or by using the keyword search tool below to find specific information within the annual report.-
 1
1 -
2
-
3
-
4
-
5
-
6
-
7
-
8
-
9
-
10
-
11
-
12
-
13
-
14
-
15
-
16
-
17
-
18
-
19
-
20
-
21
-
22
-
23
-
24
-
25
-
26
-
27
-
28
-
29
-
30
-
31
-
32
-
33
-
34
-
35
-
36
-
37
-
38
-
39
-
40
-
41
-
42
-
43
-
44
-
45
-
46
-
47
-
48
-
49
-
50
-
51
-
52
-
53
-
54
-
55
-
56
-
57
-
58
-
59
-
60
-
61
-
62
-
63
-
64
-
65
-
66
-
67
-
68
-
69
-
70
-
71
-
72
-
73
-
74
-
75
-
76
-
77
-
 78
78 -
 79
79 -
 80
80 -
 81
81 -
 82
82 -
 83
83 -
 84
84 -
 85
85 -
 86
86 -
 87
87 -
 88
88 -
 89
89 -
 90
90 -
 91
91 -
 92
92 -
 93
93 -
 94
94 -
 95
95 -
 96
96 -
 97
97 -
 98
98 -
99
-
100
-
101
-
102
-
103
-
104
-
105
-
106
-
107
-
108
-
109
-
110
-
111
-
112
-
113
-
114
-
115
-
116
-
117
-
118
-
119
-
120
-
121
-
122
-
123
-
124
-
125
 |
 |
Humana Inc.
NOTES TO CONSOLIDATED FINANCIAL STATEMENTS—(Continued)
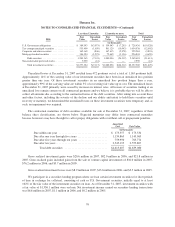
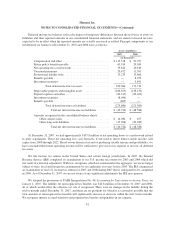
Other intangible assets primarily relate to acquired customer contracts and are included with other long-term
assets in the consolidated balance sheets. Amortization expense for other intangible assets was approximately
$22.4 million in 2007, $20.0 million in 2006 and $23.8 million in 2005. The following table presents our estimate
of amortization expense for each of the five next succeeding fiscal years:
(in thousands)
For the years ending December 31,:
2008 ...................................................... $35,571
2009 ...................................................... $26,950
2010 ...................................................... $23,423
2011 ...................................................... $21,433
2012 ...................................................... $19,610
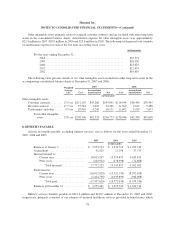
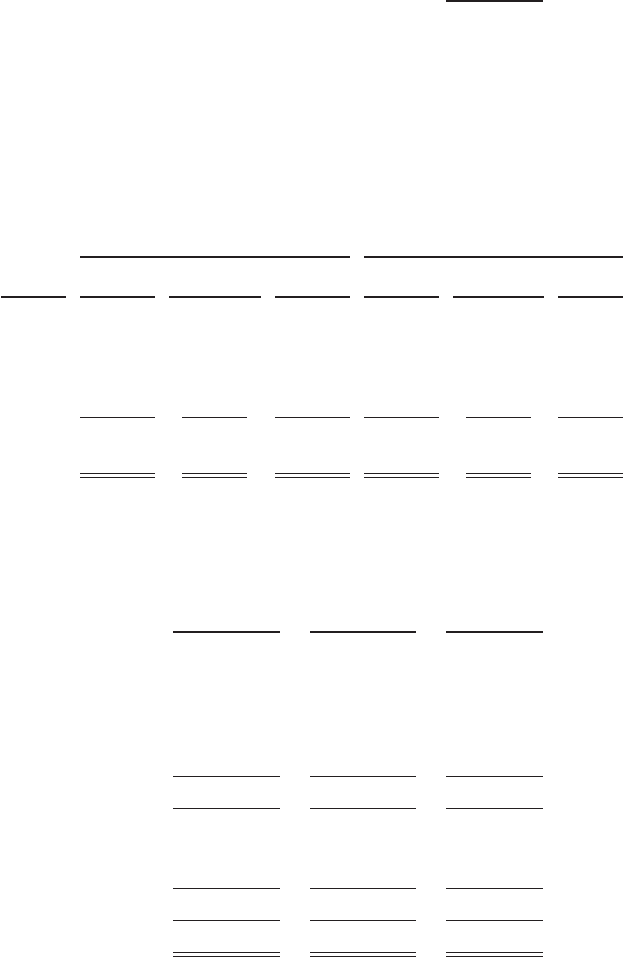
The following table presents details of our other intangible assets included in other long-term assets in the
accompanying consolidated balance sheets at December 31, 2007 and 2006:
Weighted
Average
Life
2007 2006
Cost
Accumulated
Amortization Net Cost
Accumulated
Amortization Net
(in thousands)
Other intangible assets:
Customer contracts ........ 13.5 yrs $251,107 $55,266 $195,841 $114,944 $36,449 $78,495
Provider contracts ........ 17.7 yrs 27,783 3,022 24,761 11,500 2,012 9,488
Trade names and other ..... 9.5yrs 20,416 4,245 16,171 11,602 3,929 7,673
Total other intangible
assets ............ 13.8 yrs $299,306 $62,533 $236,773 $138,046 $42,390 $95,656
8. BENEFITS PAYABLE
Activity in benefits payable, excluding military services, was as follows for the years ended December 31,
2007, 2006 and 2005:
2007 2006 2005
(in thousands)
Balances at January 1 ................. $ 1,979,733 $ 1,334,716 $ 1,074,310
Acquisitions ......................... 41,029 21,198 37,375
Incurred related to:
Current year ..................... 18,015,247 15,374,855 9,635,435
Prior years ...................... (242,922) (178,998) (72,868)
Total incurred ............... 17,772,325 15,195,857 9,562,567
Paid related to:
Current year ..................... (16,012,828) (13,532,139) (8,392,628)
Prior years ...................... (1,424,798) (1,039,899) (946,908)
Total paid ................... (17,437,626) (14,572,038) (9,339,536)
Balances at December 31 .............. $ 2,355,461 $ 1,979,733 $ 1,334,716
Military services benefits payable of $341.4 million and $430.7 million at December 31, 2007 and 2006,
respectively, primarily consisted of our estimate of incurred healthcare services provided to beneficiaries which
78