Humana 2007 Annual Report Download - page 54
Download and view the complete annual report
Please find page 54 of the 2007 Humana annual report below. You can navigate through the pages in the report by either clicking on the pages listed below, or by using the keyword search tool below to find specific information within the annual report.-
 1
1 -
2
-
3
-
4
-
5
-
6
-
7
-
8
-
9
-
10
-
11
-
12
-
13
-
14
-
15
-
16
-
17
-
18
-
19
-
20
-
21
-
22
-
23
-
24
-
25
-
26
-
27
-
28
-
29
-
30
-
31
-
32
-
33
-
34
-
35
-
36
-
37
-
38
-
39
-
40
-
41
-
42
-
43
-
 44
44 -
 45
45 -
 46
46 -
 47
47 -
 48
48 -
 49
49 -
 50
50 -
 51
51 -
 52
52 -
 53
53 -
 54
54 -
 55
55 -
 56
56 -
 57
57 -
 58
58 -
 59
59 -
 60
60 -
 61
61 -
 62
62 -
 63
63 -
 64
64 -
65
-
66
-
67
-
68
-
69
-
70
-
71
-
72
-
73
-
74
-
75
-
76
-
77
-
78
-
79
-
80
-
81
-
82
-
83
-
84
-
85
-
86
-
87
-
88
-
89
-
90
-
91
-
92
-
93
-
94
-
95
-
96
-
97
-
98
-
99
-
100
-
101
-
102
-
103
-
104
-
105
-
106
-
107
-
108
-
109
-
110
-
111
-
112
-
113
-
114
-
115
-
116
-
117
-
118
-
119
-
120
-
121
-
122
-
123
-
124
-
125
 |
 |

for 2005. Expenses related to the litigation settlement increased the SG&A expense ratio 60 basis points for
2005. After considering the effect of the litigation, the increase primarily resulted from an increase in the
percentage of small group members comprising our total fully-insured membership as well as the continued shift
in the mix of membership towards ASO. At December 31, 2005, 37% of our Commercial segment medical
membership related to ASO business compared to 47% at December 31, 2006. Small group accounts bear a
higher SG&A ratio than larger group accounts and ASO business bears a significantly higher SG&A ratio than
fully-insured business.
Depreciation and Amortization
Depreciation and amortization for 2006 totaled $148.6 million compared to $128.9 million in 2005, an
increase of $19.7 million, or 15.3%. The increase resulted primarily from capital expenditures related to the
Medicare expansion.
Interest Expense
Interest expense was $63.1 million for 2006, compared to $39.3 million for 2005, an increase of $23.8
million. This increase primarily resulted from higher average outstanding debt and higher interest rates.
Income Taxes
Our effective tax rate for 2006 of 36.0% increased 9.7% compared to the 26.3% effective tax rate for 2005.
The higher effective tax rate for 2006 is primarily due to the resolution of a contingent tax gain of $22.8 million
in the first quarter of 2005 in connection with the expiration of the statute of limitations on an uncertain tax
position related to the 2000 tax year which did not recur in 2006. See Note 9 to the consolidated financial
statements included in Item 8.—Financial Statements and Supplementary Data for a complete reconciliation of
the federal statutory rate to the effective tax rate.
Liquidity
Our primary sources of cash include receipts of premiums, ASO fees, investment income, as well as
proceeds from the sale or maturity of our investment securities and from borrowings. Our primary uses of cash
include disbursements for claims payments, SG&A expenses, interest expense, taxes, purchases of investment
securities, acquisitions, capital expenditures, and payments on borrowings. Because premiums generally are
collected in advance of claim payments by a period of up to several months in many instances, our business
normally should produce positive cash flows during periods of increasing enrollment. Conversely, cash flows
would be negatively impacted during periods of decreasing enrollment. We have experienced improving
operating cash flows associated with growth in Medicare enrollment. The use of operating cash flows may be
limited by regulatory requirements which require, among other items, that our regulated subsidiaries maintain
minimum levels of capital.
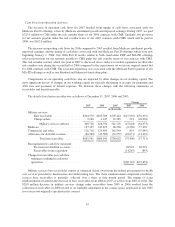
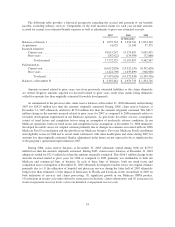
Cash and cash equivalents increased to $2,040.5 million at December 31, 2007 from $1,740.3 million at
December 31, 2006. The change in cash and cash equivalents for the years ended December 31, 2007, 2006 and
2005 is summarized as follows:
2007 2006 2005
(in thousands)
Net cash provided by operating activities ......... $1,224,262 $ 1,686,712 $ 610,082
Net cash used in investing activities ............. (1,845,391) (1,654,066) (767,276)
Net cash provided by financing activities ......... 921,278 975,642 309,131
Increase in cash and cash equivalents ............ $ 300,149 $ 1,008,288 $ 151,937
44