Humana 2007 Annual Report Download - page 46
Download and view the complete annual report
Please find page 46 of the 2007 Humana annual report below. You can navigate through the pages in the report by either clicking on the pages listed below, or by using the keyword search tool below to find specific information within the annual report.-
 1
1 -
2
-
3
-
4
-
5
-
6
-
7
-
8
-
9
-
10
-
11
-
12
-
13
-
14
-
15
-
16
-
17
-
18
-
19
-
20
-
21
-
22
-
23
-
24
-
25
-
26
-
27
-
28
-
29
-
30
-
31
-
32
-
33
-
34
-
35
-
 36
36 -
 37
37 -
 38
38 -
 39
39 -
 40
40 -
 41
41 -
 42
42 -
 43
43 -
 44
44 -
 45
45 -
 46
46 -
 47
47 -
 48
48 -
 49
49 -
 50
50 -
 51
51 -
 52
52 -
 53
53 -
 54
54 -
 55
55 -
 56
56 -
57
-
58
-
59
-
60
-
61
-
62
-
63
-
64
-
65
-
66
-
67
-
68
-
69
-
70
-
71
-
72
-
73
-
74
-
75
-
76
-
77
-
78
-
79
-
80
-
81
-
82
-
83
-
84
-
85
-
86
-
87
-
88
-
89
-
90
-
91
-
92
-
93
-
94
-
95
-
96
-
97
-
98
-
99
-
100
-
101
-
102
-
103
-
104
-
105
-
106
-
107
-
108
-
109
-
110
-
111
-
112
-
113
-
114
-
115
-
116
-
117
-
118
-
119
-
120
-
121
-
122
-
123
-
124
-
125
 |
 |

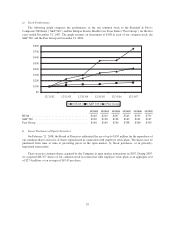
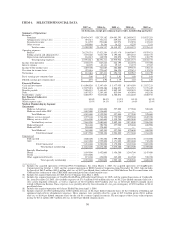
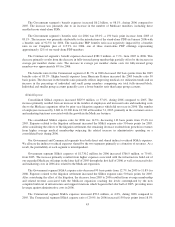
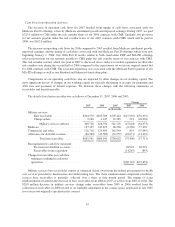
Medical membership was as follows at December 31, 2007 and 2006:
Change
2007 2006 Members Percentage
Government segment medical members:
Medicare Advantage .............................. 1,143,000 1,002,600 140,400 14.0%
Medicare stand-alone PDP ......................... 3,442,000 3,536,600 (94,600) (2.7)%
Total Medicare .............................. 4,585,000 4,539,200 45,800 1.0%
Military services ................................. 1,719,100 1,716,400 2,700 0.2%
Military services ASO ............................. 1,146,800 1,163,600 (16,800) (1.4)%
Total military services ......................... 2,865,900 2,880,000 (14,100) (0.5)%
Medicaid ....................................... 384,400 390,700 (6,300) (1.6)%
Medicaid ASO ................................... 180,600 178,400 2,200 1.2%
Total Medicaid .............................. 565,000 569,100 (4,100) (0.7)%
Total Government ............................ 8,015,900 7,988,300 27,600 0.3%
Commercial segment medical members:
Fully-insured .................................... 1,808,600 1,754,200 54,400 3.1%
ASO........................................... 1,643,000 1,529,600 113,400 7.4%
Total Commercial ............................ 3,451,600 3,283,800 167,800 5.1%
Total medical membership ............................. 11,467,500 11,272,100 195,400 1.7%
These tables of financial data should be reviewed in connection with the discussion on the following pages.
Summary
Net income was $833.7 million, or $4.91 per diluted common share, in 2007 compared to $487.4 million, or
$2.90 per diluted common share, in 2006. The year-over-year increase in earnings primarily resulted from higher
operating earnings in our Government segment largely due to increased premium revenue from higher average
Medicare membership.
Premium Revenues and Medical Membership
Premium revenues increased $3.7 billion, or 17.9%, to $24.4 billion for 2007, compared to $20.7 billion for
2006 primarily due to higher premium revenues in the Government segment. Premium revenues reflect changes
in membership and increases in average per member premiums. Items impacting average per member premiums
include changes in premium rates as well as changes in the geographic mix of membership, the mix of product
offerings, the mix of benefit plans selected by our membership, the impact of the risk corridor provisions, and
changes in health status factors or risk adjustment provisions.
Government segment premium revenues increased $3.6 billion, or 24.8%, to $18.2 billion for 2007
compared to $14.6 billion for 2006 primarily attributable to higher average Medicare membership from the
expanded participation in various Medicare products. Average membership is calculated by summing the ending
membership for each month in a period and dividing the result by the number of months in a period. Average
Medicare Advantage membership increased 26.4% for 2007 compared to 2006. Sales of our PFFS products drove
the majority of the 140,400 increase in ending Medicare Advantage members since December 31, 2006. Average
Medicare stand-alone PDP membership increased 19.5% for 2007 compared to 2006.
Commercial segment premium revenues increased $81.8 million, or 1.3%, to $6.2 billion for 2007 primarily
due to our specialty product offerings, including dental, vision, and other supplemental health and life products,
36