Humana 2007 Annual Report Download - page 74
Download and view the complete annual report
Please find page 74 of the 2007 Humana annual report below. You can navigate through the pages in the report by either clicking on the pages listed below, or by using the keyword search tool below to find specific information within the annual report.-
 1
1 -
2
-
3
-
4
-
5
-
6
-
7
-
8
-
9
-
10
-
11
-
12
-
13
-
14
-
15
-
16
-
17
-
18
-
19
-
20
-
21
-
22
-
23
-
24
-
25
-
26
-
27
-
28
-
29
-
30
-
31
-
32
-
33
-
34
-
35
-
36
-
37
-
38
-
39
-
40
-
41
-
42
-
43
-
44
-
45
-
46
-
47
-
48
-
49
-
50
-
51
-
52
-
53
-
54
-
55
-
56
-
57
-
58
-
59
-
60
-
61
-
62
-
63
-
 64
64 -
 65
65 -
 66
66 -
 67
67 -
 68
68 -
 69
69 -
 70
70 -
 71
71 -
 72
72 -
 73
73 -
 74
74 -
 75
75 -
 76
76 -
 77
77 -
 78
78 -
 79
79 -
 80
80 -
 81
81 -
 82
82 -
 83
83 -
 84
84 -
85
-
86
-
87
-
88
-
89
-
90
-
91
-
92
-
93
-
94
-
95
-
96
-
97
-
98
-
99
-
100
-
101
-
102
-
103
-
104
-
105
-
106
-
107
-
108
-
109
-
110
-
111
-
112
-
113
-
114
-
115
-
116
-
117
-
118
-
119
-
120
-
121
-
122
-
123
-
124
-
125
 |
 |

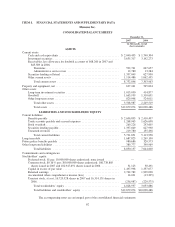
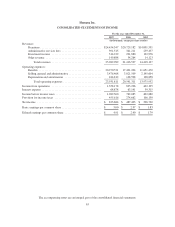
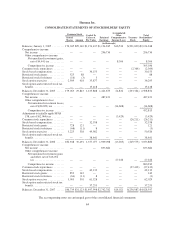
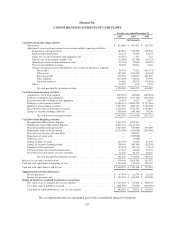
Humana Inc.
CONSOLIDATED STATEMENTS OF STOCKHOLDERS’ EQUITY
Common Stock Capital In
Excess of
Par Value
Retained
Earnings
Accumulated
Other
Comprehensive
Income (Loss)
Treasury
Stock
Total
Stockholders’
Equity
Issued
Shares Amount
(in thousands)
Balances, January 1, 2005 .........176,045 $29,340 $1,154,437 $1,124,945 $16,526 $(201,000) $2,124,248
Comprehensive income:
Net income ................... — — — 296,730 — — 296,730
Other comprehensive income:
Net unrealized investment gains,
net of $4,441 tax ........... — — — — 8,306 — 8,306
Comprehensive income ....... 305,036
Common stock repurchases ........ — — — — — (2,364) (2,364)
Stock-based compensation ......... — — 30,153 — — — 30,153
Restricted stock grants ............ 525 88 — — — — 88
Restricted stock forfeitures ........ (16) (3) 3 — — — —
Stock option exercises ............ 2,509 418 35,877 — — — 36,295
Stock option and restricted stock tax
benefit ....................... — — 15,418 — — — 15,418
Balances, December 31, 2005 ......179,063 29,843 1,235,888 1,421,675 24,832 (203,364) 2,508,874
Comprehensive income:
Net income ................... — — — 487,423 — — 487,423
Other comprehensive loss:
Net unrealized investment losses,
net of $(20,853) tax ........
— — — — (34,608) — (34,608)
Comprehensive income ....... 452,815
Adjustment to initially apply SFAS
158, net of $(2,064) tax ......... — — — — (3,429) — (3,429)
Common stock repurchases ........ — — — — — (26,211) (26,211)
Stock-based compensation ......... — — 32,558 — — — 32,558
Restricted stock grants ............ 728 121 — — — — 121
Restricted stock forfeitures ........ (68) (11) 8 — — — (3)
Stock option exercises ............ 3,225 538 49,982 — — — 50,520
Stock option and restricted stock tax
benefit ....................... — — 38,641 — — — 38,641
Balances, December 31, 2006 ......182,948 30,491 1,357,077 1,909,098 (13,205) (229,575) 3,053,886
Comprehensive income:
Net income ................... — — — 833,684 — — 833,684
Other comprehensive income:
Net unrealized investment gains
and other, net of $16,052
tax...................... — — — — 27,226 — 27,226
Comprehensive income ....... 860,910
Common stock repurchases ........ — — — — — (27,412) (27,412)
Stock-based compensation ......... — — 42,132 — — — 42,132
Restricted stock grants ............ 852 142 — — — — 142
Restricted stock forfeitures ........ (64) (11) 8 — — — (3)
Stock option exercises ............ 3,003 501 61,528 — — — 62,029
Stock option and restricted stock tax
benefit ....................... — — 37,253 — — — 37,253
Balances, December 31, 2007 ......186,739 $31,123 $1,497,998 $2,742,782 $14,021 $(256,987) $4,028,937
The accompanying notes are an integral part of the consolidated financial statements.
64