Humana 2007 Annual Report Download - page 85
Download and view the complete annual report
Please find page 85 of the 2007 Humana annual report below. You can navigate through the pages in the report by either clicking on the pages listed below, or by using the keyword search tool below to find specific information within the annual report.-
 1
1 -
2
-
3
-
4
-
5
-
6
-
7
-
8
-
9
-
10
-
11
-
12
-
13
-
14
-
15
-
16
-
17
-
18
-
19
-
20
-
21
-
22
-
23
-
24
-
25
-
26
-
27
-
28
-
29
-
30
-
31
-
32
-
33
-
34
-
35
-
36
-
37
-
38
-
39
-
40
-
41
-
42
-
43
-
44
-
45
-
46
-
47
-
48
-
49
-
50
-
51
-
52
-
53
-
54
-
55
-
56
-
57
-
58
-
59
-
60
-
61
-
62
-
63
-
64
-
65
-
66
-
67
-
68
-
69
-
70
-
71
-
72
-
73
-
74
-
 75
75 -
 76
76 -
 77
77 -
 78
78 -
 79
79 -
 80
80 -
 81
81 -
 82
82 -
 83
83 -
 84
84 -
 85
85 -
 86
86 -
 87
87 -
 88
88 -
 89
89 -
 90
90 -
 91
91 -
 92
92 -
 93
93 -
 94
94 -
 95
95 -
96
-
97
-
98
-
99
-
100
-
101
-
102
-
103
-
104
-
105
-
106
-
107
-
108
-
109
-
110
-
111
-
112
-
113
-
114
-
115
-
116
-
117
-
118
-
119
-
120
-
121
-
122
-
123
-
124
-
125
 |
 |

Humana Inc.
NOTES TO CONSOLIDATED FINANCIAL STATEMENTS—(Continued)
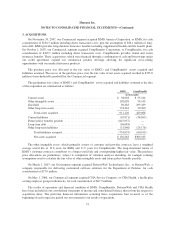
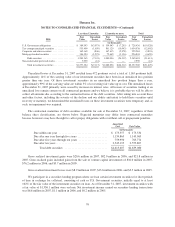
4. INVESTMENT SECURITIES
Investment securities classified as current assets were as follows at December 31, 2007 and 2006:
2007 2006
Amortized
Cost
Gross
Unrealized
Gains
Gross
Unrealized
Losses
Fair
Value
Amortized
Cost
Gross
Unrealized
Gains
Gross
Unrealized
Losses
Fair
Value
(in thousands)
U.S. Government obligations ....... $ 710,459 $ 9,592 $ (1,619) $ 718,432 $ 843,798 $ 2,029 $ (8,539) $ 837,288
Tax exempt municipal securities .... 1,735,163 10,011 (5,774) 1,739,400 1,331,894 3,200 (11,462) 1,323,632
Corporate and other securities ...... 507,385 7,183 (6,522) 508,046 459,888 1,258 (3,559) 457,587
Mortgage-backed securities ........ 656,404 9,360 (2,143) 663,621 566,748 4,137 (4,355) 566,530
Debt securities .............. 3,609,411 36,146 (16,058) 3,629,499 3,202,328 10,624 (27,915) 3,185,037
Non-redeemable preferred stocks . . . 7,250 — (1,432) 5,818 7,251 — (15) 7,236
Investment securities ......... $3,616,661 $36,146 $(17,490) $3,635,317 $3,209,579 $10,624 $(27,930) $3,192,273
Investment securities classified as long-term assets were as follows at December 31, 2007 and 2006:
2007 2006
Amortized
Cost
Gross
Unrealized
Gains
Gross
Unrealized
Losses
Fair
Value
Amortized
Cost
Gross
Unrealized
Gains
Gross
Unrealized
Losses
Fair
Value
(in thousands)
U.S. Government obligations ...... $ 263,125 $2,936 $ (490) $ 265,571 $156,770 $ 63 $(1,789) $155,044
Tax exempt municipal securities .... 125,231 831 (471) 125,591 106,453 90 (1,140) 105,403
Corporate and other securities ...... 424,424 3,198 (3,287) 424,335 108,004 120 (265) 107,859
Mortgage-backed securities ....... 178,758 1,206 (1,438) 178,526 27,684 116 (304) 27,496
Redeemable preferred stocks ...... 14,658 900 — 15,558 12,741 4,750 — 17,491
Debt securities .............. 1,006,196 9,071 (5,686) 1,009,581 411,652 5,139 (3,498) 413,293
Non-redeemable preferred stocks . . . 1,517 16 (143) 1,390 724 — (1) 723
Common stocks ................. 4,081 — (2) 4,079 861 — — 861
Equity securities ............ 5,598 16 (145) 5,469 1,585 — (1) 1,584
Long-term investment
securities ................ $1,011,794 $9,087 $(5,831) $1,015,050 $413,237 $5,139 $(3,499) $414,877
Long-term investment securities with a fair value of $116.6 million at December 31, 2007 and $99.1 million
at December 31, 2006 were on deposit at financial institutions in certain states pursuant to the respective states’
insurance regulations.
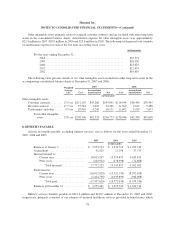
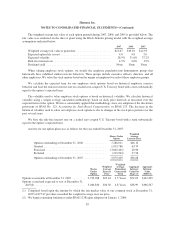
Gross unrealized losses and fair value aggregated by investment category and length of time that individual
securities have been in a continuous unrealized loss position were as follows at December 31, 2007 and 2006:
Less than 12 months 12 months or more Total
2007
Fair
Value
Unrealized
Losses
Fair
Value
Unrealized
Losses
Fair
Value
Unrealized
Losses
(in thousands)
U.S. Government obligations ....................... $ 46,272 $ (391) $169,599 $(1,718) $ 215,871 $ (2,109)
Tax exempt municipal securities ..................... 265,816 (4,098) 284,644 (2,147) 550,460 (6,245)
Corporate and other securities ....................... 323,102 (8,645) 52,564 (1,164) 375,666 (9,809)
Mortgage-backed securities ........................ 104,656 (1,282) 124,071 (2,299) 228,727 (3,581)
Debt securities ............................... 739,846 (14,416) 630,878 (7,328) 1,370,724 (21,744)
Non-redeemable preferred stocks .................... 6,400 (1,575) — — 6,400 (1,575)
Common stocks .................................. 3 (2) — — 3 (2)
Equity securities ............................. 6,403 (1,577) — — 6,403 (1,577)
Total investment securities ..................... $746,249 $(15,993) $630,878 $(7,328) $1,377,127 $(23,321)
75