Humana 2007 Annual Report Download - page 56
Download and view the complete annual report
Please find page 56 of the 2007 Humana annual report below. You can navigate through the pages in the report by either clicking on the pages listed below, or by using the keyword search tool below to find specific information within the annual report.-
 1
1 -
2
-
3
-
4
-
5
-
6
-
7
-
8
-
9
-
10
-
11
-
12
-
13
-
14
-
15
-
16
-
17
-
18
-
19
-
20
-
21
-
22
-
23
-
24
-
25
-
26
-
27
-
28
-
29
-
30
-
31
-
32
-
33
-
34
-
35
-
36
-
37
-
38
-
39
-
40
-
41
-
42
-
43
-
44
-
45
-
 46
46 -
 47
47 -
 48
48 -
 49
49 -
 50
50 -
 51
51 -
 52
52 -
 53
53 -
 54
54 -
 55
55 -
 56
56 -
 57
57 -
 58
58 -
 59
59 -
 60
60 -
 61
61 -
 62
62 -
 63
63 -
 64
64 -
 65
65 -
 66
66 -
67
-
68
-
69
-
70
-
71
-
72
-
73
-
74
-
75
-
76
-
77
-
78
-
79
-
80
-
81
-
82
-
83
-
84
-
85
-
86
-
87
-
88
-
89
-
90
-
91
-
92
-
93
-
94
-
95
-
96
-
97
-
98
-
99
-
100
-
101
-
102
-
103
-
104
-
105
-
106
-
107
-
108
-
109
-
110
-
111
-
112
-
113
-
114
-
115
-
116
-
117
-
118
-
119
-
120
-
121
-
122
-
123
-
124
-
125
 |
 |

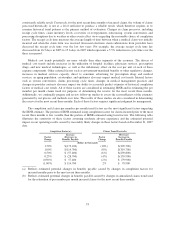
Despite significant growth in Medicare, Medicare receivables declined $6.5 million from 2006 to 2007 due
to the net collection of receivables associated with the CMS risk adjustment model. Likewise, the $77.3 million
increase in Medicare receivables from 2005 to 2006 resulted from an increase in receivables associated with the
CMS risk adjustment model.
The decline in Commercial and other receivables from 2005 to 2006 resulted from the change in the mix of
members from fully-insured to ASO.
The $22.7 million increase in the allowance for doubtful accounts from 2006 to 2007 resulted from the
growth of the Medicare business.
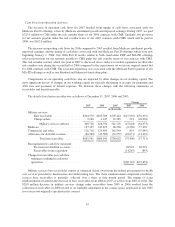
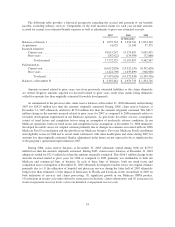
The detail of benefits payable was as follows at December 31, 2007, 2006 and 2005:
Change
2007 2006 2005 2007 2006
(in thousands)
IBNR(1) .......................... $1,712,599 $1,600,198 $1,013,949 $112,401 $586,249
Military services benefits payable(2) . . . 341,372 430,674 514,426 (89,302) (83,752)
Reported claims in process(3) ......... 91,938 98,033 67,065 (6,095) 30,968
Other benefits payable(4) ............ 550,924 281,502 253,702 269,422 27,800
Total benefits payable ............... $2,696,833 $2,410,407 $1,849,142 286,426 561,265
Reconciliation to cash flow statement:
Benefits payable from acquisition ...... (41,029) (21,198)
Change in benefits payable in cash flow
statement resulting in cash from
operations ...................... $245,397 $540,067
(1) IBNR represents an estimate of benefits payable for claims incurred but not reported (IBNR) at the balance
sheet date. The level of IBNR is primarily impacted by membership levels, medical claim trends and the
receipt cycle time, which represents the length of time between when a claim is initially incurred and when
the claim form is received (i.e. a shorter time span results in a lower IBNR).
(2) Military services benefits payable primarily results from the timing of the cost of providing health care
services to beneficiaries and the related reimbursement by the federal government as more fully described in
Note 2 to the consolidated financial statements included in Item 8.—Financial Statements and
Supplementary Data. A corresponding receivable is included in the base receivable in the previous
receivables table.
(3) Reported claims in process represents the estimated valuation of processed claims that are in the post claim
adjudication process, which consists of administrative functions such as audit and check batching and
handling.
(4) Other benefits payable includes capitation and pharmacy payables. The balance due to our pharmacy benefit
administrator fluctuates due to bi-weekly payments and the month-end cutoff.
Benefits payable increased during 2007 and 2006 primarily due to growth in Medicare membership and to a
lesser extent medical claims inflation.
Cash Flow from Investing Activities
We reinvested a portion of our operating cash flows over the last several years in investment securities,
primarily short-duration fixed income securities, totaling $430.1 million in 2007, $862.1 million in 2006, and $233.3
million in 2005. Our ongoing capital expenditures primarily relate to our information technology initiatives and
administrative facilities necessary for activities such as claims processing, billing and collections, medical utilization
review, and customer service. Total capital expenditures, excluding acquisitions, were $239.2 million in 2007,
$193.2 million in 2006, and $165.8 million in 2005. The increased spending in 2007 primarily resulted from the
46