Humana 2007 Annual Report Download - page 63
Download and view the complete annual report
Please find page 63 of the 2007 Humana annual report below. You can navigate through the pages in the report by either clicking on the pages listed below, or by using the keyword search tool below to find specific information within the annual report.-
 1
1 -
2
-
3
-
4
-
5
-
6
-
7
-
8
-
9
-
10
-
11
-
12
-
13
-
14
-
15
-
16
-
17
-
18
-
19
-
20
-
21
-
22
-
23
-
24
-
25
-
26
-
27
-
28
-
29
-
30
-
31
-
32
-
33
-
34
-
35
-
36
-
37
-
38
-
39
-
40
-
41
-
42
-
43
-
44
-
45
-
46
-
47
-
48
-
49
-
50
-
51
-
52
-
 53
53 -
 54
54 -
 55
55 -
 56
56 -
 57
57 -
 58
58 -
 59
59 -
 60
60 -
 61
61 -
 62
62 -
 63
63 -
 64
64 -
 65
65 -
 66
66 -
 67
67 -
 68
68 -
 69
69 -
 70
70 -
 71
71 -
 72
72 -
 73
73 -
74
-
75
-
76
-
77
-
78
-
79
-
80
-
81
-
82
-
83
-
84
-
85
-
86
-
87
-
88
-
89
-
90
-
91
-
92
-
93
-
94
-
95
-
96
-
97
-
98
-
99
-
100
-
101
-
102
-
103
-
104
-
105
-
106
-
107
-
108
-
109
-
110
-
111
-
112
-
113
-
114
-
115
-
116
-
117
-
118
-
119
-
120
-
121
-
122
-
123
-
124
-
125
 |
 |

consistently reliable result. Conversely, for the most recent three months of incurred claims, the volume of claims
processed historically is not at a level sufficient to produce a reliable result, which therefore requires us to
examine historical trend patterns as the primary method of evaluation. Changes in claim processes, including
receipt cycle times, claim inventory levels, recoveries of overpayments, outsourcing, system conversions, and
processing disruptions due to weather or other events affect views regarding the reasonable choice of completion
factors. The receipt cycle time measures the average length of time between when a medical claim was initially
incurred and when the claim form was received. Increased electronic claim submissions from providers have
decreased the receipt cycle time over the last few years. For example, the average receipt cycle time has
decreased from 16.5 days in 2005 to 15.6 days in 2007 which represents a 5.5% reduction in cycle time over the
three year period.
Medical cost trends potentially are more volatile than other segments of the economy. The drivers of
medical cost trends include increases in the utilization of hospital facilities, physician services, prescription
drugs, and new medical technologies, as well as the inflationary effect on the cost per unit of each of these
expense components. Other external factors such as government-mandated benefits or other regulatory changes,
increases in medical services capacity, direct to consumer advertising for prescription drugs and medical
services, an aging population, catastrophes, and epidemics also may impact medical cost trends. Internal factors
such as system conversions, claims processing cycle times, changes in medical management practices and
changes in provider contracts also may impact our ability to accurately predict estimates of historical completion
factors or medical cost trends. All of these factors are considered in estimating IBNR and in estimating the per
member per month claims trend for purposes of determining the reserve for the most recent three months.
Additionally, we continually prepare and review follow-up studies to assess the reasonableness of the estimates
generated by our process and methods over time. The results of these studies are also considered in determining
the reserve for the most recent three months. Each of these factors requires significant judgment by management.
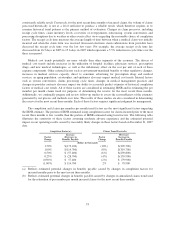
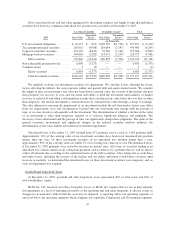
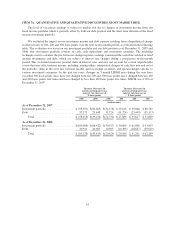
The completion and claims per member per month trend factors are the most significant factors impacting
the IBNR estimate. The portion of IBNR estimated using completion factors for claims incurred prior to the most
recent three months is less variable than the portion of IBNR estimated using trend factors. The following table
illustrates the sensitivity of these factors assuming moderate adverse experience and the estimated potential
impact on our operating results caused by reasonably likely changes in these factors based on December 31, 2007
data:
Completion Factor(a): Claims Trend Factor(b):
Factor
Change
Increase
(Decrease) in
Benefits Payable
Factor
Change
(Decrease)
Increase in
Benefits Payable
(dollars in thousands)
1.50% $(172,100) (10%) $(399,700)
1.00% $(114,700) (8%) $(319,700)
0.50% $ (57,400) (6%) $(239,800)
0.25% $ (28,700) (4%) $(159,900)
(0.50%) $ 57,400 (2%) $ (79,900)
(1.00%) $ 114,700 2% $ 79,900
(a) Reflects estimated potential changes in benefits payable caused by changes in completion factors for
incurred months prior to the most recent three months.
(b) Reflects estimated potential changes in benefits payable caused by changes in annualized claims trend used
for the estimation of per member per month incurred claims for the most recent three months.
53