Humana 2007 Annual Report Download - page 103
Download and view the complete annual report
Please find page 103 of the 2007 Humana annual report below. You can navigate through the pages in the report by either clicking on the pages listed below, or by using the keyword search tool below to find specific information within the annual report.-
 1
1 -
2
-
3
-
4
-
5
-
6
-
7
-
8
-
9
-
10
-
11
-
12
-
13
-
14
-
15
-
16
-
17
-
18
-
19
-
20
-
21
-
22
-
23
-
24
-
25
-
26
-
27
-
28
-
29
-
30
-
31
-
32
-
33
-
34
-
35
-
36
-
37
-
38
-
39
-
40
-
41
-
42
-
43
-
44
-
45
-
46
-
47
-
48
-
49
-
50
-
51
-
52
-
53
-
54
-
55
-
56
-
57
-
58
-
59
-
60
-
61
-
62
-
63
-
64
-
65
-
66
-
67
-
68
-
69
-
70
-
71
-
72
-
73
-
74
-
75
-
76
-
77
-
78
-
79
-
80
-
81
-
82
-
83
-
84
-
85
-
86
-
87
-
88
-
89
-
90
-
91
-
92
-
 93
93 -
 94
94 -
 95
95 -
 96
96 -
 97
97 -
 98
98 -
 99
99 -
 100
100 -
 101
101 -
 102
102 -
 103
103 -
 104
104 -
 105
105 -
 106
106 -
 107
107 -
 108
108 -
 109
109 -
 110
110 -
 111
111 -
 112
112 -
 113
113 -
114
-
115
-
116
-
117
-
118
-
119
-
120
-
121
-
122
-
123
-
124
-
125
 |
 |

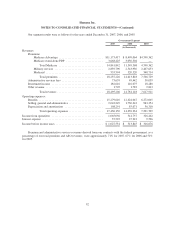
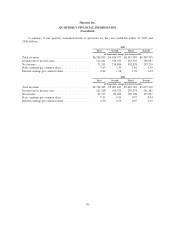
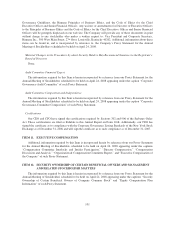
Humana Inc.
NOTES TO CONSOLIDATED FINANCIAL STATEMENTS—(Continued)
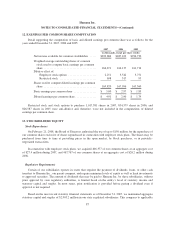
Commercial Segment
2007 2006 2005
(in thousands)
Revenues:
Premiums:
Fully-insured:
PPO .......................................... $3,664,019 $3,684,442 $3,635,347
HMO ......................................... 1,998,981 2,019,936 2,432,768
Total fully-insured ........................... 5,663,000 5,704,378 6,068,115
Specialty .......................................... 534,121 410,986 386,747
Total premiums ............................. 6,197,121 6,115,364 6,454,862
Administrative services fees ............................... 317,856 291,769 209,378
Investment income ...................................... 131,623 175,805 124,696
Other revenue .......................................... 148,183 52,481 11,280
Total revenues .............................. 6,794,783 6,635,419 6,800,216
Operating expenses:
Benefits ............................................... 4,990,921 4,997,157 5,379,425
Selling, general and administrative .......................... 1,434,219 1,291,266 1,232,250
Depreciation and amortization ............................. 76,521 63,527 72,548
Total operating expenses ...................... 6,501,661 6,351,950 6,684,223
Income from operations ...................................... 293,122 283,469 115,993
Interest expense ............................................. 31,353 35,229 29,789
Income before income taxes ................................... $ 261,769 $ 248,240 $ 86,204
16. REINSURANCE
Certain blocks of insurance assumed in acquisitions, primarily life, long-term care and annuities in run-off
status, are subject to reinsurance where some or all of the underwriting risk related to these policies has been
ceded to a third party. In addition, a large portion of our reinsurance takes the form of 100% coinsurance
agreements where, in addition to all of the underwriting risk, all administrative responsibilities, including
premium collections and claim payment, have also been ceded to a third party. We acquired these policies and
related reinsurance agreements with the purchase of stock of companies in which the policies were originally
written. We acquired these companies for business reasons unrelated to these particular policies, including the
companies’ other products and licenses necessary to fulfill strategic plans.
A reinsurance agreement between two entities transfers the underwriting risk of policyholder liabilities to a
reinsurer while the primary insurer retains the contractual relationship with the ultimate insured. As such, these
reinsurance agreements do no completely relieve us of our potential liability to the ultimate insured. However,
given the transfer of underwriting risk, our potential liability is limited to the credit exposure which exists should
the reinsurer be unable to meet its obligations assumed under these reinsurance agreements.
Reinsurance recoverables represent the portion of future policy benefits payable that are covered by
reinsurance. Amounts recoverable from reinsurers are estimated in a manner consistent with the methods used to
determine future policy benefits payable as detailed in Note 2. Reinsurance recoverables, included in other long-
term assets, were $341.6 million at December 31, 2007 and $242.7 million at December 31, 2006. The
percentage of these reinsurance recoverables resulting from 100% coinsurance agreements was 70% at
93