Humana 2007 Annual Report Download - page 86
Download and view the complete annual report
Please find page 86 of the 2007 Humana annual report below. You can navigate through the pages in the report by either clicking on the pages listed below, or by using the keyword search tool below to find specific information within the annual report.-
 1
1 -
2
-
3
-
4
-
5
-
6
-
7
-
8
-
9
-
10
-
11
-
12
-
13
-
14
-
15
-
16
-
17
-
18
-
19
-
20
-
21
-
22
-
23
-
24
-
25
-
26
-
27
-
28
-
29
-
30
-
31
-
32
-
33
-
34
-
35
-
36
-
37
-
38
-
39
-
40
-
41
-
42
-
43
-
44
-
45
-
46
-
47
-
48
-
49
-
50
-
51
-
52
-
53
-
54
-
55
-
56
-
57
-
58
-
59
-
60
-
61
-
62
-
63
-
64
-
65
-
66
-
67
-
68
-
69
-
70
-
71
-
72
-
73
-
74
-
75
-
 76
76 -
 77
77 -
 78
78 -
 79
79 -
 80
80 -
 81
81 -
 82
82 -
 83
83 -
 84
84 -
 85
85 -
 86
86 -
 87
87 -
 88
88 -
 89
89 -
 90
90 -
 91
91 -
 92
92 -
 93
93 -
 94
94 -
 95
95 -
 96
96 -
97
-
98
-
99
-
100
-
101
-
102
-
103
-
104
-
105
-
106
-
107
-
108
-
109
-
110
-
111
-
112
-
113
-
114
-
115
-
116
-
117
-
118
-
119
-
120
-
121
-
122
-
123
-
124
-
125
 |
 |

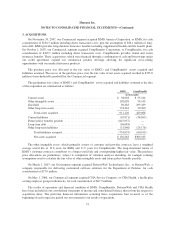
Humana Inc.
NOTES TO CONSOLIDATED FINANCIAL STATEMENTS—(Continued)
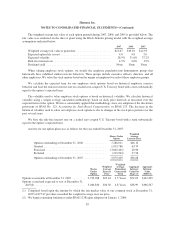
Less than 12 months 12 months or more Total
2006
Fair
Value
Unrealized
Losses
Fair
Value
Unrealized
Losses
Fair
Value
Unrealized
Losses
(in thousands)
U.S. Government obligations ................... $ 389,393 $(3,073) $ 339,043 $ (7,255) $ 728,436 $(10,328)
Tax exempt municipal securities ................ 533,409 (1,659) 501,129 (10,943) 1,034,538 (12,602)
Corporate and other securities .................. 162,169 (846) 167,415 (2,978) 329,584 (3,824)
Mortgage-backed securities .................... 184,394 (1,523) 72,449 (3,136) 256,843 (4,659)
Debt securities .......................... 1,269,365 (7,101) 1,080,036 (24,312) 2,349,401 (31,413)
Non-redeemable preferred stocks ................ 7,959 (16) — — 7,959 (16)
Total investment securities ................. $1,277,324 $(7,117) $1,080,036 $(24,312) $2,357,360 $(31,429)
Unrealized losses at December 31, 2007 resulted from 472 positions out of a total of 1,165 positions held.
Approximately 14% of the carrying value of our investment securities have been in an unrealized loss position
greater than one year. Of these investment securities in an unrealized loss position longer than a year,
approximately 99% of the carrying value are within 5% of recovering fair value up to cost. The unrealized losses
at December 31, 2007 primarily were caused by increases in interest rates. All issuers of securities trading at an
unrealized loss remain current on all contractual payments and we believe it is probable that we will be able to
collect all amounts due according to the contractual terms of the debt securities. After taking into account these
and other factors, including the severity of the decline and our ability and intent to hold these securities until
recovery or maturity, we determined the unrealized losses on these investment securities were temporary and, as
such, no impairment was required.
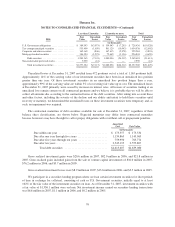
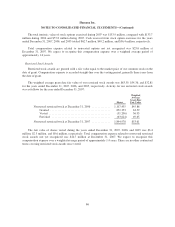
The contractual maturities of debt securities available for sale at December 31, 2007, regardless of their
balance sheet classification, are shown below. Expected maturities may differ from contractual maturities
because borrowers may have the right to call or prepay obligations with or without call or prepayment penalties.
Amortized
Cost Fair Value
(in thousands)
Due within one year .................................. $ 175,557 $ 175,534
Due after one year through five years ..................... 1,134,865 1,143,965
Due after five years through ten years .................... 759,990 763,774
Due after ten years .................................... 2,545,195 2,555,807
Total debt securities .............................. $4,615,607 $4,639,080
Gross realized investment gains were $20.6 million in 2007, $82.0 million in 2006, and $21.8 million in
2005. Gross realized gains included gains from the sale of venture capital investments of $16.0 million in 2007,
$76.2 million in 2006, and $5.7 million in 2005.
Gross realized investment losses were $8.9 million in 2007, $13.6 million in 2006, and $3.5 million in 2005.
We participate in a securities lending program where we loan certain investment securities for short periods
of time in exchange for collateral, consisting of cash or U.S. Government securities, initially equal to at least
102% of the fair value of the investment securities on loan. As of December 31, 2007, investment securities with
a fair value of $1,336.1 million were on loan. Net investment income earned on securities lending transactions
was $6.6 million in 2007, $1.1 million in 2006, and $0.2 million in 2005.
76