Humana 2007 Annual Report Download - page 96
Download and view the complete annual report
Please find page 96 of the 2007 Humana annual report below. You can navigate through the pages in the report by either clicking on the pages listed below, or by using the keyword search tool below to find specific information within the annual report.-
 1
1 -
2
-
3
-
4
-
5
-
6
-
7
-
8
-
9
-
10
-
11
-
12
-
13
-
14
-
15
-
16
-
17
-
18
-
19
-
20
-
21
-
22
-
23
-
24
-
25
-
26
-
27
-
28
-
29
-
30
-
31
-
32
-
33
-
34
-
35
-
36
-
37
-
38
-
39
-
40
-
41
-
42
-
43
-
44
-
45
-
46
-
47
-
48
-
49
-
50
-
51
-
52
-
53
-
54
-
55
-
56
-
57
-
58
-
59
-
60
-
61
-
62
-
63
-
64
-
65
-
66
-
67
-
68
-
69
-
70
-
71
-
72
-
73
-
74
-
75
-
76
-
77
-
78
-
79
-
80
-
81
-
82
-
83
-
84
-
85
-
 86
86 -
 87
87 -
 88
88 -
 89
89 -
 90
90 -
 91
91 -
 92
92 -
 93
93 -
 94
94 -
 95
95 -
 96
96 -
 97
97 -
 98
98 -
 99
99 -
 100
100 -
 101
101 -
 102
102 -
 103
103 -
 104
104 -
 105
105 -
 106
106 -
107
-
108
-
109
-
110
-
111
-
112
-
113
-
114
-
115
-
116
-
117
-
118
-
119
-
120
-
121
-
122
-
123
-
124
-
125
 |
 |

Humana Inc.
NOTES TO CONSOLIDATED FINANCIAL STATEMENTS—(Continued)
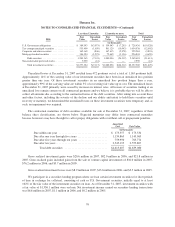
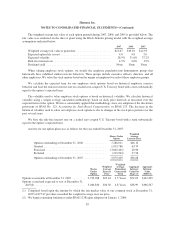
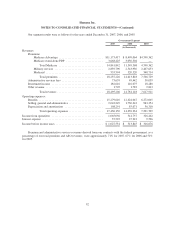
The total intrinsic value of stock options exercised during 2007 was $133.9 million, compared with $133.7
million during 2006 and $57.8 million during 2005. Cash received from stock option exercises for the years
ended December 31, 2007, 2006, and 2005 totaled $62.7 million, $49.2 million, and $36.4 million, respectively.
Total compensation expense related to nonvested options not yet recognized was $23.6 million at
December 31, 2007. We expect to recognize this compensation expense over a weighted average period of
approximately 1.6 years.
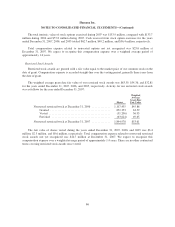
Restricted Stock Awards
Restricted stock awards are granted with a fair value equal to the market price of our common stock on the
date of grant. Compensation expense is recorded straight-line over the vesting period, generally three years from
the date of grant.
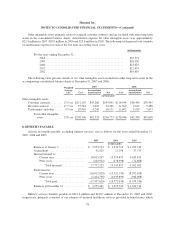
The weighted average grant date fair value of our restricted stock awards was $63.59, $54.36, and $32.81
for the years ended December 31, 2007, 2006, and 2005, respectively. Activity for our restricted stock awards
was as follows for the year ended December 31, 2007:
Shares
Weighted
Average
Grant-Date
Fair Value
Nonvested restricted stock at December 31, 2006 ............. 1,107,455 $45.86
Granted .......................................... 852,353 63.59
Vested ........................................... (51,206) 56.93
Forfeited ......................................... (63,624) 49.65
Nonvested restricted stock at December 31, 2007 ............. 1,844,978 $53.61
The fair value of shares vested during the years ended December 31, 2007, 2006, and 2005 was $3.4
million, $2.3 million, and $0.6 million, respectively. Total compensation expense related to nonvested restricted
stock awards not yet recognized was $44.7 million at December 31, 2007. We expect to recognize this
compensation expense over a weighted average period of approximately 1.4 years. There are no other contractual
terms covering restricted stock awards once vested.
86