Nike 2011 Annual Report Download - page 14
Download and view the complete annual report
Please find page 14 of the 2011 Nike annual report below. You can navigate through the pages in the report by either clicking on the pages listed below, or by using the keyword search tool below to find specific information within the annual report.-
 1
1 -
2
-
3
-
 4
4 -
 5
5 -
 6
6 -
 7
7 -
 8
8 -
 9
9 -
 10
10 -
 11
11 -
 12
12 -
 13
13 -
 14
14 -
 15
15 -
 16
16 -
 17
17 -
 18
18 -
 19
19 -
 20
20 -
 21
21 -
 22
22 -
 23
23 -
 24
24 -
25
-
26
-
27
-
28
-
29
-
30
-
31
-
32
-
33
-
34
-
35
-
36
-
37
-
38
-
39
-
40
-
41
-
42
-
43
-
44
-
45
-
46
-
47
-
48
-
49
-
50
-
51
-
52
-
53
-
54
-
55
-
56
-
57
-
58
-
59
-
60
-
61
-
62
-
63
-
64
-
65
-
66
-
67
-
68
 |
 |

14 NIKE,INC.-Form10-K
PARTII
ITEM5Market for Registrant’s Common Equity, Related Stockholder Matters and Issuer Purchases of Equity Securities
PARTII
ITEM5 Market for Registrant’s Common Equity,
Related Stockholder Matters and Issuer
Purchases of Equity Securities
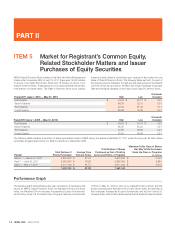
NIKE’s ClassB Common Stock is listed on the New York Stock Exchange and
trades under the symbol NKE. At July18,2011, there were 16,400 holders
of record of our ClassB Common Stock and 19 holders of record of our
ClassA Common Stock. These fi gures do not include benefi cial owners who
hold shares in nominee name. The ClassA Common Stock is not publicly
traded but each share is convertible upon request of the holder into one
share of ClassB Common Stock. The following tables set forth, for each of
the quarterly periods indicated, the high and low sales prices for the ClassB
Common Stock as reported on the New York Stock Exchange Composite
Tape and dividends declared on the ClassA and ClassB Common Stock.
Fiscal 2011 (June1,2010— May31,2011) High Low
Dividends
Declared
First Quarter $ 74.94 $ 67.21 $ 0.27
Second Quarter 86.53 72.13 0.31
Third Quarter 92.30 81.46 0.31
Fourth Quarter 89.88 75.45 0.31
Fiscal 2010 (June1,2009— May31,2010) High Low
Dividends
Declared
First Quarter $ 59.95 $ 50.16 $ 0.25
Second Quarter 66.35 53.22 0.27
Third Quarter 67.85 60.89 0.27
Fourth Quarter 78.55 66.99 0.27
The following table presents a summary of share repurchases made by NIKE during the quarter ended May31,2011 under the four-year, $5billion share
repurchase program approved by our Board of Directors in September2008.
Period
Total Number of
Shares Purchased
Average Price
Paid per Share
Total Number of Shares
Purchased as Partof Publicly
Announced Plans or Programs
Maximum Dollar Value of Shares
that MayYet Be Purchased
Underthe Plans or Programs
(Inmillions)
March1— March31,2011 2,800,000 $ 81.76 2,800,000 $ 3,052
April1— April30,2011 2,650,000 $ 78.92 2,650,000 $ 2,843
May1— May31,2011 2,011,100 $ 83.77 2,011,100 $ 2,675
7,461,100 $ 81.29 7,461,100
Performance Graph
The following graph demonstrates a fi ve-year comparison of cumulative total
returns for NIKE’s ClassB Common Stock, the Standard& Poor’s 500 Stock
Index, the Standard& Poor’s Apparel, Accessories& Luxury Goods Index,
and the Dow Jones U.S. Footwear Index. The graph assumes an investment
of $100 on May31,2006 in each of our ClassB Common Stock, and the
stocks comprising the Standard& Poor’s 500 Stock Index, the Standard&
Poor’s Apparel, Accessories& Luxury Goods Index, and the Dow Jones U.S.
Footwear Index. Each of the indices assumes that all dividends were reinvested.