Nike 2011 Annual Report Download - page 56
Download and view the complete annual report
Please find page 56 of the 2011 Nike annual report below. You can navigate through the pages in the report by either clicking on the pages listed below, or by using the keyword search tool below to find specific information within the annual report.-
 1
1 -
2
-
3
-
4
-
5
-
6
-
7
-
8
-
9
-
10
-
11
-
12
-
13
-
14
-
15
-
16
-
17
-
18
-
19
-
20
-
21
-
22
-
23
-
24
-
25
-
26
-
27
-
28
-
29
-
30
-
31
-
32
-
33
-
34
-
35
-
36
-
37
-
38
-
39
-
40
-
41
-
42
-
43
-
44
-
45
-
 46
46 -
 47
47 -
 48
48 -
 49
49 -
 50
50 -
 51
51 -
 52
52 -
 53
53 -
 54
54 -
 55
55 -
 56
56 -
 57
57 -
 58
58 -
 59
59 -
 60
60 -
 61
61 -
 62
62 -
 63
63 -
 64
64 -
 65
65 -
 66
66 -
67
-
68
 |
 |

56 NIKE,INC.-Form10-K
PARTII
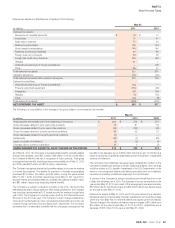
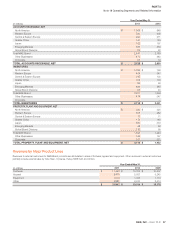
Note18Operating Segments and Related Information
(Inmillions)
Year Ended May31,
2011 2010 2009
REVENUE
North America $ 7,578 $ 6,696 $ 6,778
Western Europe 3,810 3,892 4,139
Central& Eastern Europe 1,031 993 1,247
Greater China 2,060 1,742 1,743
Japan 766 882 926
Emerging Markets 2,736 2,199 1,828
Global Brand Divisions 123 105 96
Total NIKE Brand 18,104 16,509 16,757
Other Businesses 2,747 2,530 2,419
Corporate 11 (25) —
TOTAL NIKE CONSOLIDATED REVENUES $ 20,862 $ 19,014 $ 19,176
EARNINGS BEFORE INTEREST AND TAXES
North America $ 1,750 $ 1,538 $ 1,429
Western Europe 721 856 939
Central& Eastern Europe 233 253 394
Greater China 777 637 575
Japan 114 180 205
Emerging Markets 688 521 364
Global Brand Divisions (998) (867) (811)
Total NIKE Brand 3,285 3,118 3,095
Other Businesses(1) 334 299 (193)
Corporate(2) (771) (894) (955)
Total NIKE Consolidated Earnings Before Interest and Taxes 2,848 2,523 1,947
Interest expense (income), net 4 6 (10)
TOTAL NIKE CONSOLIDATED EARNINGS BEFORE TAXES $ 2,844 $ 2,517 $ 1,957
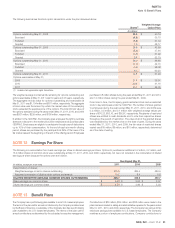
ADDITIONS TO LONG-LIVED ASSETS
North America $ 79 $ 45 $ 99
Western Europe 75 59 70
Central& Eastern Europe 5 4 7
Greater China 43 80 59
Japan 9 12 10
Emerging Markets 21 11 12
Global Brand Divisions 44 30 37
Total NIKE Brand 276 241 294
Other Businesses 38 52 90
Corporate 118 42 72
TOTAL ADDITIONS TO LONG-LIVED ASSETS $ 432 $ 335 $ 456
DEPRECIATION
North America $ 70 $ 65 $ 64
Western Europe 52 57 51
Central& Eastern Europe 4 4 4
Greater China 19 11 7
Japan 22 26 30
Emerging Markets 14 12 10
Global Brand Divisions 39 33 43
Total NIKE Brand 220 208 209
Other Businesses 44 46 38
Corporate 71 70 88
TOTAL DEPRECIATION $ 335 $ 324 $ 335
(1) During the year ended May31,2009, the Other category included a pre-tax charge of $401million for the impairment of goodwill, intangible and other assets of Umbro, which was recorded
in the third quarter of fiscal 2009. See Note4— Identifiable Intangible Assets, Goodwill and Umbro Impairment for more information.
(2) During the year ended May31,2009, Corporate expense included pre-tax charges of $195million for the Company’s restructuring activities, which were completed in the fourth quarter
offiscal 2009. See Note16— Restructuring Charges for more information.