Nike 2011 Annual Report Download - page 45
Download and view the complete annual report
Please find page 45 of the 2011 Nike annual report below. You can navigate through the pages in the report by either clicking on the pages listed below, or by using the keyword search tool below to find specific information within the annual report.-
 1
1 -
2
-
3
-
4
-
5
-
6
-
7
-
8
-
9
-
10
-
11
-
12
-
13
-
14
-
15
-
16
-
17
-
18
-
19
-
20
-
21
-
22
-
23
-
24
-
25
-
26
-
27
-
28
-
29
-
30
-
31
-
32
-
33
-
34
-
 35
35 -
 36
36 -
 37
37 -
 38
38 -
 39
39 -
 40
40 -
 41
41 -
 42
42 -
 43
43 -
 44
44 -
 45
45 -
 46
46 -
 47
47 -
 48
48 -
 49
49 -
 50
50 -
 51
51 -
 52
52 -
 53
53 -
 54
54 -
 55
55 -
56
-
57
-
58
-
59
-
60
-
61
-
62
-
63
-
64
-
65
-
66
-
67
-
68
 |
 |

45NIKE,INC.-Form10-K
PARTII
Note6Fair Value Measurements
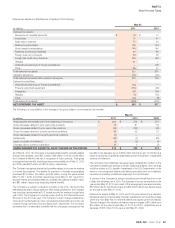
NOTE5 Accrued Liabilities
Accrued liabilities included the following:
(Inmillions)
May31,
2011 2010
Compensation and benefi ts, excluding taxes $ 628 $ 599
Endorser compensation 284 267
Taxes other than income taxes 214 158
Fair value of derivatives 186 164
Dividends payable 145 131
Advertising and marketing 139 125
Import and logistics costs 98 80
Other(1) 291 380
$ 1,985 $ 1,904
(1) Other consists of various accrued expenses and no individual item accounted for more than 5% of the balance at May31,2011 and 2010.
NOTE6 Fair Value Measurements
The Company measures certain fi nancial assets and liabilities at fair value
on a recurring basis, including derivatives and available-for-sale securities.
Fairvalue is a market-based measurement that should be determined based
on the assumptions that market participants would use in pricing an asset
or liability.As a basis for considering such assumptions, the Company uses
a three-levelhierarchy established by the FASB that prioritizes fair value
measurements based on the types of inputs used for the various valuation
techniques (market approach, income approach, and cost approach).
The levels of hierarchy are described below:
•
Level1:Observable inputs such as quoted prices in active markets for
identical assets or liabilities.
•
Level2:Inputs other than quoted prices that are observable for the asset
or liability, either directly or indirectly; these include quoted prices for similar
assets or liabilities in active markets and quoted prices for identical or similar
assets or liabilities in markets that are not active.
•
Level3:Unobservable inputs in which there is little or no market data
available, which require the reporting entity to develop its own assumptions.
The Company’s assessment of the signifi cance of a particular input to the fair
value measurement in its entirety requires judgment and considers factors
specifi c to the asset or liability.Financial assets and liabilities are classifi ed in
their entirety based on the most stringent levelof input that is signifi cant to
the fair value measurement.
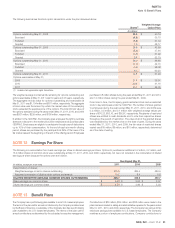
The following table presents information about the Company’s fi nancial assets
and liabilities measured at fair value on a recurring basis as of May31,2011
and 2010 and indicates the fair value hierarchy of the valuation techniques
utilized by the Company to determine such fair value.
(Inmillions)
May31,2011
Fair Value
MeasurementsUsing Assets/Liabilities
at Fair Value BalanceSheetClassifi cationLevel1 Level2 Level3
ASSETS
Derivatives:
Foreign exchange forwards and options $ — $ 38 $ — $ 38 Other current assets and other long-term assets
Interest rate swap contracts — 15 — 15 Other current assets and other long-term assets
Total derivatives — 53 — 53
Available-for-sale securities:
U.S. Treasury securities 125 — — 125 Cash equivalents
Commercial paper and bonds — 157 — 157 Cash equivalents
Money market funds — 780 — 780 Cash equivalents
U.S. Treasury securities 1,473 — — 1,473 Short-term investments
U.S. Agency securities — 308 — 308 Short-term investments
Commercial paper and bonds — 802 — 802 Short-term investments
Total available-for-sale securities 1,598 2,047 — 3,645
TOTAL ASSETS $ 1,598 $ 2,100 $ — $ 3,698
LIABILITIES
Derivatives:
Foreign exchange forwards and options $ — $ 197 $ — $ 197 Accrued liabilities and otherlong-term liabilities
TOTAL LIABILITIES $ — $ 197 $ — $ 197