Nike 2011 Annual Report Download - page 16
Download and view the complete annual report
Please find page 16 of the 2011 Nike annual report below. You can navigate through the pages in the report by either clicking on the pages listed below, or by using the keyword search tool below to find specific information within the annual report.-
 1
1 -
2
-
3
-
4
-
5
-
 6
6 -
 7
7 -
 8
8 -
 9
9 -
 10
10 -
 11
11 -
 12
12 -
 13
13 -
 14
14 -
 15
15 -
 16
16 -
 17
17 -
 18
18 -
 19
19 -
 20
20 -
 21
21 -
 22
22 -
 23
23 -
 24
24 -
 25
25 -
 26
26 -
27
-
28
-
29
-
30
-
31
-
32
-
33
-
34
-
35
-
36
-
37
-
38
-
39
-
40
-
41
-
42
-
43
-
44
-
45
-
46
-
47
-
48
-
49
-
50
-
51
-
52
-
53
-
54
-
55
-
56
-
57
-
58
-
59
-
60
-
61
-
62
-
63
-
64
-
65
-
66
-
67
-
68
 |
 |
16 NIKE,INC.-Form10-K
PARTII
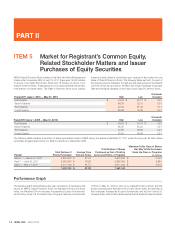
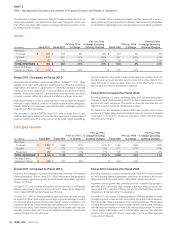
ITEM6Selected Financial Data
ITEM6 Selected Financial Data
(Inmillions, except per share data and fi nancial ratios)
Financial History
2011 2010 2009 2008 2007
Year Ended May31,
Revenues $ 20,862 $ 19,014 $ 19,176 $ 18,627 $ 16,326
Gross margin 9,508 8,800 8,604 8,387 7,161
Gross margin % 45.6 % 46.3 % 44.9 % 45.0 % 43.9 %
Restructuring charges — — 195 — —
Goodwill impairment — — 199 — —
Intangible and other asset impairment — — 202 — —
Net income 2,133 1,907 1,487 1,883 1,492
Basic earnings per common share 4.48 3.93 3.07 3.80 2.96
Diluted earnings per common share 4.39 3.86 3.03 3.74 2.93
Weighted average common shares outstanding 475.5 485.5 484.9 495.6 503.8
Diluted weighted average common shares outstanding 485.7 493.9 490.7 504.1
509.9
Cash dividends declared per common share 1.20 1.06 0.98 0.875 0.71
Cash fl ow from operations 1,812 3,164 1,736 1,936 1,879
Price range of common stock
High 92.30 78.55 70.28 70.60 57.12
Low 67.21 50.16 38.24 51.50 37.76
At May31,
Cash and equivalents $ 1,955 $ 3,079 $ 2,291 $ 2,134 $ 1,857
Short-term investments 2,583 2,067 1,164 642 990
Inventories 2,715 2,041 2,357 2,438 2,122
Working capital 7,339 7,595 6,457 5,518 5,493
Total assets 14,998 14,419 13,250 12,443 10,688
Long-term debt 276 446 437 441 410
Redeemable Preferred Stock 0.3 0.3 0.3 0.3 0.3
Shareholders’ equity 9,843 9,754 8,693 7,825 7,025
Year-end stock price 84.45 72.38 57.05 68.37 56.75
Market capitalization 39,523 35,032 27,698 33,577 28,472
Financial Ratios:
Return on equity 21.8 % 20.7 % 18.0 %
25.4 % 22.4 %
Return on assets 14.5 % 13.8 % 11.6 % 16.3 % 14.5 %
Inventory turns 4.8 4.6 4.4 4.5 4.4
Current ratio at May31 2.9 3.3 3.0 2.7 3.1
Price/Earnings ratio at May31 19.2 18.8 18.8 18.3 19.4
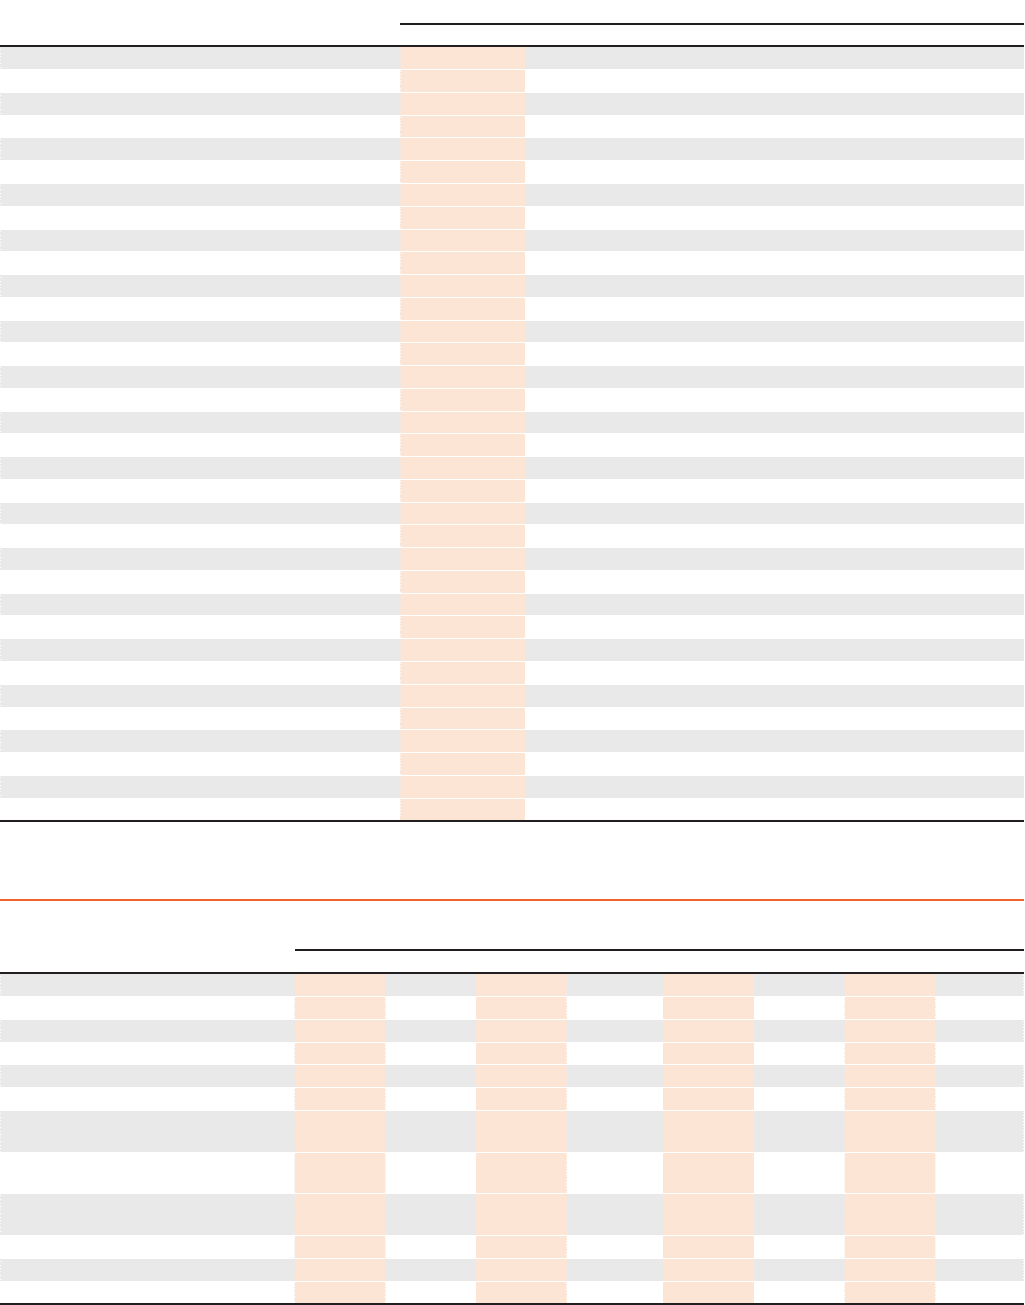
Selected Quarterly Financial Data
(Unaudited)
(Inmillions, except per share data)
1st Quarter 2nd Quarter 3rd Quarter 4th Quarter
2011 2010 2011 2010 2011 2010 2011 2010
Revenues $ 5,175 $ 4,799 $ 4,842 $ 4,405 $ 5,079 $ 4,733 $ 5,766 $ 5,077
Gross margin 2,434 2,216 2,193 1,960 2,327 2,218 2,554 2,406
Gross margin % 47.0 % 46.2 % 45.3 % 44.5 % 45.8 % 46.9 % 44.3 % 47.4 %
Net income 559 513 457 375 523 496 594 522
Basic earnings per common share 1.17 1.06 0.96 0.77 1.10 1.02 1.27 1.08
Diluted earnings per common share 1.14 1.04 0.94 0.76 1.08 1.01 1.24 1.06
Weighted average common shares
outstanding 479.6 485.8 477.9 487.2 475.3 484.4 469.3 484.4
Diluted weighted average common
shares outstanding 488.6 491.6 487.6 494.5 485.5 492.3
478.7 493.9
Cash dividends declared per common
share 0.27 0.25 0.31 0.27 0.31 0.27 0.31 0.27
Price range of common stock
High 74.94 59.95 86.53 66.35 92.30 67.85 89.88 78.55
Low 67.21 50.16 72.13 53.22 81.46 60.89 75.45 66.99