Nike 2011 Annual Report Download - page 51
Download and view the complete annual report
Please find page 51 of the 2011 Nike annual report below. You can navigate through the pages in the report by either clicking on the pages listed below, or by using the keyword search tool below to find specific information within the annual report.-
 1
1 -
2
-
3
-
4
-
5
-
6
-
7
-
8
-
9
-
10
-
11
-
12
-
13
-
14
-
15
-
16
-
17
-
18
-
19
-
20
-
21
-
22
-
23
-
24
-
25
-
26
-
27
-
28
-
29
-
30
-
31
-
32
-
33
-
34
-
35
-
36
-
37
-
38
-
39
-
40
-
 41
41 -
 42
42 -
 43
43 -
 44
44 -
 45
45 -
 46
46 -
 47
47 -
 48
48 -
 49
49 -
 50
50 -
 51
51 -
 52
52 -
 53
53 -
 54
54 -
 55
55 -
 56
56 -
 57
57 -
 58
58 -
 59
59 -
 60
60 -
 61
61 -
62
-
63
-
64
-
65
-
66
-
67
-
68
 |
 |

51NIKE,INC.-Form10-K
PARTII
Note13Benefi t Plans
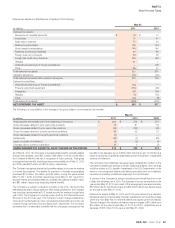
The following summarizes the stock option transactions under the plan discussed above:
Shares(1)
Weighted Average
Option Price
(Inmillions)
Options outstanding May31,2008
36.6
$ 40.14
Exercised
(4.0
) 35.70
Forfeited
(1.3
) 51.19
Granted 7.5 58.17
Options outstanding May31,2009 38.8 $ 43.69
Exercised (8.6) 37.64
Forfeited (0.6) 51.92
Granted 6.4 52.79
Options outstanding May31,2010 36.0 $ 46.60
Exercised (7.0) 42.70
Forfeited (0.5) 58.08
Granted 6.3 69.20
Options outstanding May31,2011 34.8 $ 51.29
Options exercisable at May31,
2009 21.4 $ 36.91
2010 20.4 41.16
2011 20.1 $ 44.05
(1) Includes stock appreciation rights transactions.
The weighted average contractual life remaining for options outstanding and
options exercisable at May31,2011 was 6.0years and 4.5years, respectively.
The aggregate intrinsic value for options outstanding and exercisable at
May31,2011 was $1,154million and $811million, respectively. The aggregate
intrinsic value was the amount by which the market value of the underlying
stock exceeded the exercise price of the options. The total intrinsic value of
the options exercised during theyears ended May31,2011,2010, and 2009
was $267million, $239million, and $108million, respectively.
In addition to the 1990 Plan, the Company gives employees the right to purchase
shares at a discount to the market price under employee stock purchase plans
(“ESPPs”). Employees are eligible to participate through payroll deductions
up to 10% of their compensation. At the end of each six-month offering
period, shares are purchased by the participants at 85% of the lower of the
fair market value at the beginning or the end of the offering period. Employees
purchased 0.8million shares during theyears ended May31,2011 and 2010,
and 1.0million shares during the year ended May31,2009.
From time to time, the Company grants restricted stock and unrestricted
stock to key employees under the 1990 Plan. The number of shares granted
to employees during theyears ended May31,2011,2010, and 2009 were
0.2million, 0.5million, and 0.1million with weighted average values per
share of $70.23, $53.16, and $56.97, respectively. Recipients of restricted
shares are entitled to cash dividends and to vote their respective shares
throughout the period of restriction. The value of all of the granted shares
was established by the market price on the date of grant. During theyears
ended May31,2011,2010, and 2009, the fair value of restricted shares
vested was $15million, $8million, and $10million, respectively, determined
as of the date of vesting.
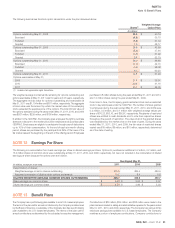
NOTE12 Earnings Per Share
The following is a reconciliation from basic earnings per share to diluted earnings per share. Options to purchase an additional 0.2million, 0.2million, and
13.2million shares of common stock were outstanding at May31,2011,2010, and 2009, respectively, but were not included in the computation of diluted
earnings per share because the options were anti-dilutive.
(Inmillions, except per share data)
Year Ended May31,
2011 2010 2009
Determination of shares:
Weighted average common shares outstanding 475.5 485.5 484.9
Assumed conversion of dilutive stock options and awards 10.2 8.4 5.8
DILUTED WEIGHTED AVERAGE COMMON SHARES OUTSTANDING 485.7 493.9 490.7
Basic earnings per common share $ 4.48 $ 3.93 $ 3.07
Diluted earnings per common share $ 4.39 $ 3.86 $ 3.03
NOTE13 Benefi t Plans
The Company has a profi t sharing plan available to most U.S.-based employees.
The terms of the plan call for annual contributions by the Company as determined
by the Board of Directors. A subsidiary of the Company also has a profi t sharing
plan available to its U.S.-based employees. The terms of the plan call for
annual contributions as determined by the subsidiary’s executive management.
Contributions of $39million, $35million, and $28million were made to the
plans and are included in selling and administrative expense fortheyears ended
May31,2011,2010, and 2009, respectively. The Company has various 401(k)
employee savings plans available to U.S.-based employees. The Company
matches a portion of employee contributions. Companycontributions to