Nike 2011 Annual Report Download - page 17
Download and view the complete annual report
Please find page 17 of the 2011 Nike annual report below. You can navigate through the pages in the report by either clicking on the pages listed below, or by using the keyword search tool below to find specific information within the annual report.-
 1
1 -
2
-
3
-
4
-
5
-
6
-
 7
7 -
 8
8 -
 9
9 -
 10
10 -
 11
11 -
 12
12 -
 13
13 -
 14
14 -
 15
15 -
 16
16 -
 17
17 -
 18
18 -
 19
19 -
 20
20 -
 21
21 -
 22
22 -
 23
23 -
 24
24 -
 25
25 -
 26
26 -
 27
27 -
28
-
29
-
30
-
31
-
32
-
33
-
34
-
35
-
36
-
37
-
38
-
39
-
40
-
41
-
42
-
43
-
44
-
45
-
46
-
47
-
48
-
49
-
50
-
51
-
52
-
53
-
54
-
55
-
56
-
57
-
58
-
59
-
60
-
61
-
62
-
63
-
64
-
65
-
66
-
67
-
68
 |
 |
17NIKE,INC.-Form10-K
PARTII
ITEM7Management’s Discussion and Analysis of Financial Condition and Results of Operations
ITEM7 Management’s Discussion and Analysis of
Financial Condition and Results of Operations
NIKE designs, develops, markets and sells high quality footwear, apparel,
equipment and accessory products worldwide. We are the largest seller
of athletic footwear and apparel in the world. We sell our products to retail
accounts, through NIKE-owned retail stores and internet sales, which we refer
to as our “Direct to Consumer” operations, and through a mix of independent
distributors and licensees, worldwide. Our goal is to deliver value to our
shareholders by building a profi table global portfolio of branded footwear,
apparel, equipment and accessories businesses. Our strategy is to achieve
long-term revenue growth by creating innovative, “must have” products,
building deep personal consumer connections with our brands, and delivering
compelling retail presentation and experiences.
In addition to achieving long-term revenue growth, we continue to strive to
deliver shareholder value by driving operational excellence in several key areas:
•
Making our supply chain a competitive advantage through operational discipline,
• Reducing product costs through a continued focus on lean manufacturing
and product design that strives to eliminate waste,
•
Improving selling and administrative expense productivity by focusing on
investments that drive economic returns in the form of incremental revenue
and gross margin, and leveraging existing infrastructure across our portfolio
of brands to eliminate duplicative costs,
• Improving working capital effi ciency, and
• Deploying capital effectively to create value for our shareholders.
Through execution of this strategy, our long-term fi nancial goals continue to be:
• High single-digit revenue growth,
• Mid-teens earnings per share growth,
• Increased return on invested capital and accelerated cash fl ows, and
•
Consistent results through effective management of our diversifi ed portfolio
of businesses.
Over the past tenyears, we have achieved or exceeded all of these fi nancial
goals. During this time, NIKE,Inc’s revenues and earnings per share have
grown 8% and 15%, respectively, on an annual compounded basis. Our return
on invested capital has increased from 14% to 22% and we expanded gross
margins by more than 5 percentage points.
Our fi scal2011 results demonstrated our continued focus toward meeting
our fi nancial goals, while positioning ourselves for sustainable, profi table
long-term growth. Despite the uncertain macroeconomic environment in
fi scal2011, wedelivered record high revenues and diluted earnings per
share. Our revenues grew 10% to $20.9billion, net income increased 12%
to $2.1billion, and we delivered diluted earnings per share of $4.39, a 14%
increase from fi scal2010.
Income before income taxes increased 13% for fi scal2011 primarily as a
result of the increase in revenues and leverage on selling and administrative
expense, which more than offset a decrease in gross margin percentage.
The increase in revenues is refl ective of increased demand for NIKE Brand
footwear and apparel products across most businesses, particularly in the
North America, Emerging Markets and Greater China geographies. Demand for
our NIKE Brand footwear and apparel was fueled by our innovative products
as well as strong category focused retail presentations. The decrease in
gross margin percentage was primarily driven by higher product input costs,
increased transportation expenses and a lower mix of licensee revenue as
certain markets within our Other Businesses transitioned to NIKE,Inc. owned
markets. These factors more than offset the positive impact from the growth
and expanding profi tability of our NIKE Brand Direct to Consumer business
and our ongoing product cost reduction initiatives.
Net income for fi scal2011 was negatively impacted by ayear-over-year
increase of 80 basis points in our effective tax rate, driven primarily by an
increase in the percentage of total pre-tax income earned from operations
in the UnitedStates. The UnitedStates statutory tax rate is generally higher
than the tax rate on operations outside the UnitedStates.
For theyear, diluted earnings per share grew at a higher rate than net income
due to a 2% decrease in the weighted average number of diluted common
shares outstanding driven by our share repurchases during fi scal2011. Whilewe
increased the use of working capital in fi scal2011 to support the growth of our
businesses, we returned larger amounts of cash to our shareholders through
higher dividends and increased share repurchases compared to fi scal2010.
While we continue to believe that the Company is well positioned from a
business and fi nancial perspective, our future performance is subject to the
inherent uncertainty presented by volatile macroeconomic conditions that may
have an impact on our operations around the world. Our future performance
is subject to our continued ability to take appropriate actions to respond to
these conditions.
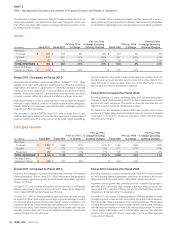
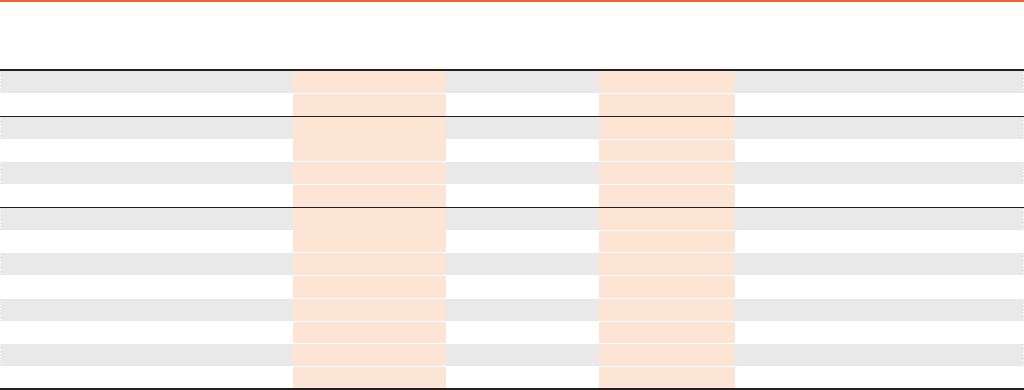
Results of Operations
(Inmillions, except per share data)
Fiscal2011 Fiscal2010
FY11vs. FY10
%Change Fiscal2009
FY10vs. FY09
%Change
Revenues $ 20,862 $ 19,014 10 % $ 19,176 -1 %
Cost of sales 11,354 10,214 11 % 10,572 -3 %
Gross margin 9,508 8,800 8 % 8,604 2 %
Gross margin % 45.6 % 46.3 % 44.9 %
Demand creation expense 2,448 2,356 4 % 2,352 0 %
Operating overhead expense 4,245 3,970 7 % 3,798 5 %
Total selling and administrative expense 6,693 6,326 6 %
6,150 3 %
% of Revenues 32.1 % 33.3 % 32.1 %
Restructuring charges — — — 195 —
Goodwill impairment — — — 199 —
Intangible and other asset impairment — — — 202 —
Income before income taxes 2,844 2,517 13 % 1,957 29 %
Net income 2,133 1,907 12 % 1,487 28 %
Diluted earnings per share 4.39 3.86 14 % 3.03 27 %