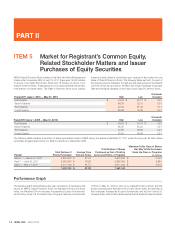
Nike 2011 Annual Report Download - page 24
Download and view the complete annual report
Please find page 24 of the 2011 Nike annual report below. You can navigate through the pages in the report by either clicking on the pages listed below, or by using the keyword search tool below to find specific information within the annual report.-
 1
1 -
2
-
3
-
4
-
5
-
6
-
7
-
8
-
9
-
10
-
11
-
12
-
13
-
 14
14 -
 15
15 -
 16
16 -
 17
17 -
 18
18 -
 19
19 -
 20
20 -
 21
21 -
 22
22 -
 23
23 -
 24
24 -
 25
25 -
 26
26 -
 27
27 -
 28
28 -
 29
29 -
 30
30 -
 31
31 -
 32
32 -
 33
33 -
 34
34 -
35
-
36
-
37
-
38
-
39
-
40
-
41
-
42
-
43
-
44
-
45
-
46
-
47
-
48
-
49
-
50
-
51
-
52
-
53
-
54
-
55
-
56
-
57
-
58
-
59
-
60
-
61
-
62
-
63
-
64
-
65
-
66
-
67
-
68
 |
 |

24 NIKE,INC.-Form10-K
PARTII
ITEM7Management’s Discussion and Analysis of Financial Condition and Results of Operations
The decrease in apparel revenue for fi scal2010 was primarily due to a mid
single-digit decrease in unit sales across most major categories, which more
than offset a low single-digit increase in average selling price primarily driven
by strategic price increases.
EBIT for Greater China increased at a faster rate than revenue as a result of
higher gross margins and reductions in demand creation spending attributable
to comparisons against higher prioryear spending around the Beijing Olympics.
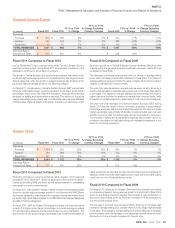
Japan
(Inmillions)
Fiscal2011 Fiscal2010
FY11vs. FY10
%Change
FY11vs. FY10
%Change Excluding
Currency Changes Fiscal2009
FY10vs. FY09
%Change
FY10vs. FY09
%Change Excluding
Currency Changes
Revenues
Footwear $ 396 $ 433 -9 % -16 % $ 430 1 % -7 %
Apparel 302 357 -15 % -23 % 397 -10 % -17 %
Equipment 68 92 -26 % -32 % 99 -7 % -13 %
TOTAL REVENUES $ 766 $ 882 -13 % -21 % $ 926 -5 % -12 %
Earnings Before
Interest and Taxes $ 114 $ 180 -37 % $ 205 -12 %
Fiscal 2011 Compared to Fiscal 2010
Macroeconomic conditions in Japan remain diffi cult. On March11,2011, Japan
experienced a major earthquake and resulting tsunami. While the Company’s
organization and assets in Japan were not materially damaged, business
results for themonth of March2011 were signifi cantly eroded by the natural
disaster. As we enter fi scal2012, we anticipate macroeconomic conditions
in Japan to remain diffi cult as consumer confi dence continues to recover.
Excluding changes in currency exchange rates, both footwear and apparel
revenues in Japan declined, driven by decreases across most key categories.
Partially offsetting the decreases was a double-digit percentage growth in
revenues from Running apparel.
The decrease in Japan’s EBIT for fi scal2011 was primarily due to lower
revenues and higher selling and administrative expense as a percentage of
revenue, partially offset by an improvement in the gross margin percentage.
The improvement in the gross margin percentage was primarily driven by
favorableyear-over-year standard currency rates and positive impacts from
fewer discounts on close-out sales, which more than offset higher product
input costs and inventory obsolescence expense.
Fiscal 2010 Compared to Fiscal 2009
Excluding changes in currency exchange rates, both footwear and apparel
revenues in Japan declined during fi scal2010 due to decreases in unit sales
across most major categories. The decline in revenues was refl ective of a
diffi cult and highly promotional marketplace in Japan.
For fi scal2010, the decrease in Japan’s EBIT was primarily due to lower
revenues and higher selling and administrative expense, driven by increased
investments in our Direct to Consumer operations, which more than offset
improved gross margins.
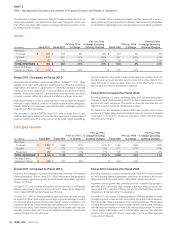
Emerging Markets
(Inmillions)
Fiscal2011 Fiscal2010
FY11vs. FY10
%Change
FY11vs. FY10
%Change Excluding
Currency Changes Fiscal2009
FY10vs. FY09
%Change
FY10vs. FY09
%Change Excluding
Currency Changes
Revenues
Footwear $ 1,897 $ 1,458 30 % 24 % $ 1,185 23 % 20 %
Apparel 657 577 14 % 9 % 477 21 % 17 %
Equipment 182 164 11 % 6 % 166 -1 % -3 %
TOTAL REVENUES $ 2,736 $ 2,199 24 % 19 % $ 1,828 20 % 17 %
Earnings Before
Interest and Taxes $ 688 $ 521 32 % $ 364 43 %
Fiscal 2011 Compared to Fiscal 2010
Excluding the changes in currency exchange rates, revenues for Emerging
Markets increased 19% for fi scal2011. Most territories in the geography
reported double-digit revenue growth for the fi scalyear, led by Brazil, Argentina,
Mexico, and Korea.
For fi scal2011, both footwear and apparel revenue growth in the Emerging
Markets was primarily driven by strong demand in nearly all key categories,
most notably NIKE Brand Sportswear and Running.
For fi scal2011, EBIT for Emerging Markets grew at a faster rate than revenue
as a result of higher gross margin percentage, improved leverage on selling
and administrative expense and favorable foreign currency translation. The
increase in the gross margin percentage was primarily due to a higher mix of
in-line product sales, lower warehousing costs and favorableyear-over-year
standard currency rates, which more than offset the increase in product input
costs and higher full-price discounts.
Fiscal 2010 Compared to Fiscal 2009
Excluding changes in currency exchange rates, fi scal2010 revenue growth
for the Emerging Markets geography was driven by growth in all product
categories and all territories, most notably Brazil, Mexico and Korea.
Footwear revenue growth was primarily driven by a double-digit growth in
unit sales and a mid single-digit increase in average selling price per pair
during fi scal2010, refl ective of strong demand for most NIKE Brand product
categories in all markets within the geography.
For fi scal2010, the increase in Emerging Markets’ EBIT was primarily the result
of revenue growth combined with lower selling and administrative expense,
which more than offset a decrease in gross margin percentage. The decrease
in selling and administrative expense was primarily due to lower operating
overhead expense resulting from fi scal2009 restructuring activities. The decline
in gross margin was primarily due to less favorableyear-over-year standard
currency rates compared to the prioryear, which more than offset improved
in-line product margins.