Nike 2011 Annual Report Download - page 21
Download and view the complete annual report
Please find page 21 of the 2011 Nike annual report below. You can navigate through the pages in the report by either clicking on the pages listed below, or by using the keyword search tool below to find specific information within the annual report.-
 1
1 -
2
-
3
-
4
-
5
-
6
-
7
-
8
-
9
-
10
-
 11
11 -
 12
12 -
 13
13 -
 14
14 -
 15
15 -
 16
16 -
 17
17 -
 18
18 -
 19
19 -
 20
20 -
 21
21 -
 22
22 -
 23
23 -
 24
24 -
 25
25 -
 26
26 -
 27
27 -
 28
28 -
 29
29 -
 30
30 -
 31
31 -
32
-
33
-
34
-
35
-
36
-
37
-
38
-
39
-
40
-
41
-
42
-
43
-
44
-
45
-
46
-
47
-
48
-
49
-
50
-
51
-
52
-
53
-
54
-
55
-
56
-
57
-
58
-
59
-
60
-
61
-
62
-
63
-
64
-
65
-
66
-
67
-
68
 |
 |

21NIKE,INC.-Form10-K
PARTII
ITEM7Management’s Discussion and Analysis of Financial Condition and Results of Operations
The breakdown of revenues follows:
(Inmillions)
Fiscal2011 Fiscal2010
(1)
FY11vs. FY10
%Change
FY11 vs. FY10
% Change
Excluding
Currency
Changes
(2) Fiscal2009
(1)
FY10
vs. FY09
%Change
FY10 vs. FY09
%Change
Excluding
Currency
Changes
(2)
North America $ 7,578 $ 6,696 13 % 13 % $ 6,778 -1 % -1 %
Western Europe 3,810 3,892 -2 % 4 % 4,139 -6 % -6 %
Central& Eastern Europe 1,031 993 4 % 7 % 1,247 -20 % -19 %
Greater China 2,060 1,742 18 % 16 % 1,743 0 % 0 %
Japan 766 882 -13 % -21 % 926 -5 % -12 %
Emerging Markets 2,736 2,199 24 % 19 % 1,828 20 % 17
%
Global Brand Divisions 123 105 17 % 21 % 96 9 % 12 %
Total NIKE Brand Revenues 18,104 16,509 10 % 10 % 16,757 -1 % -2 %
Other Businesses 2,747 2,530 9 % 8 % 2,419 5 % 4 %
Corporate
(3) 11 (25 ) — — — — —
TOTAL NIKE,INC. REVENUES $ 20,862 $ 19,014 10 % 10 % $ 19,176 -1 % -2 %
(1) Certain prioryear amounts have been reclassified to conform to fiscalyear 2011 presentation. These changes had no impact on previously reported results of operations or shareholders’ equity.
(2) Results have been restated using constant exchange rates for the comparative period to enhance the visibility of the underlying business trends excluding the impact of foreign currency
exchange rate fluctuations.
(3) Corporate revenues primarily consist of foreign currency hedge gains and losses generated by entities within the NIKE Brand geographic operating segments but managed through our
central foreign exchange risk management program, and foreign currency gains and losses resulting from the difference between actual foreign currency rates and standard rates assigned
to these entities, which are used to record any non-functional currency revenues into the entity’s functional currency.
The primary fi nancial measure used by the Company to evaluate performance of
individual operating segments is earnings before interest and taxes (commonly
referred to as “EBIT”) which represents net income before interest expense
(income), net and income taxes in the consolidated statements of income.
As discussed in Note18— Operating Segments and Related Information in
the accompanying Notes to the Consolidated Financial Statements, certain
corporate costs are not included in EBIT of our operating segments.
The breakdown of earnings before interest and taxes is as follows:
(Inmillions)
Fiscal2011 Fiscal2010
(1)
FY11 vs. FY10
%Change Fiscal2009
(1)
FY10 vs. FY09
%Change
North America $ 1,750 $ 1,538 14 % $ 1,429 8 %
Western Europe 721 856 -16 % 939 -9 %
Central& Eastern Europe 233 253 -8 % 394 -36 %
Greater China 777 637 22 % 575 11 %
Japan 114 180 -37 % 205 -12 %
Emerging Markets 688 521 32 % 364 43 %
Global Brand Divisions (998 ) (867 ) -15 % (811
) -7 %
Total NIKE Brand 3,285 3,118 5 % 3,095 1 %
Other Businesses 334 299 12 % (193 ) —
Corporate (771 ) (894 ) 14 % (955 ) 6 %
TOTAL CONSOLIDATED EARNINGS
BEFORE INTEREST AND TAXES $ 2,848 $ 2,523 13 % $ 1,947 30 %
Interest expense (income), net 4 6 -33 % (10 ) —
TOTAL CONSOLIDATED INCOME
BEFOREINCOME TAXES $ 2,844 $ 2,517 13 % $ 1,957 29 %
(1) Certain prioryear amounts have been reclassified to conform to fiscalyear 2011 presentation. These changes had no impact on previously reported results of operations or shareholders’ equity.
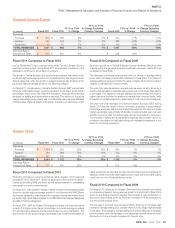
North America
(Inmillions)
Fiscal2011 Fiscal2010
FY11vs. FY10
%Change
FY11 vs. FY10
%Change Excluding
Currency Changes Fiscal2009
FY10vs. FY09
%Change
FY10 vs. FY09
%Change Excluding
Currency Changes
Revenues
Footwear $ 5,109 $ 4,610 11 % 11 % $ 4,694 -2 % -2 %
Apparel 2,105 1,740 21 % 21 % 1,740 0 % 0 %
Equipment 364 346 5 % 5 % 344 1 % 0 %
TOTAL REVENUES $ 7,578 $ 6,696 13 % 13 % $ 6,778 -1 % -1 %
Earnings Before
Interest and Taxes $ 1,750 $ 1,538 14 % $ 1,429 8 %