Nike 2011 Annual Report Download - page 18
Download and view the complete annual report
Please find page 18 of the 2011 Nike annual report below. You can navigate through the pages in the report by either clicking on the pages listed below, or by using the keyword search tool below to find specific information within the annual report.-
 1
1 -
2
-
3
-
4
-
5
-
6
-
7
-
 8
8 -
 9
9 -
 10
10 -
 11
11 -
 12
12 -
 13
13 -
 14
14 -
 15
15 -
 16
16 -
 17
17 -
 18
18 -
 19
19 -
 20
20 -
 21
21 -
 22
22 -
 23
23 -
 24
24 -
 25
25 -
 26
26 -
 27
27 -
 28
28 -
29
-
30
-
31
-
32
-
33
-
34
-
35
-
36
-
37
-
38
-
39
-
40
-
41
-
42
-
43
-
44
-
45
-
46
-
47
-
48
-
49
-
50
-
51
-
52
-
53
-
54
-
55
-
56
-
57
-
58
-
59
-
60
-
61
-
62
-
63
-
64
-
65
-
66
-
67
-
68
 |
 |

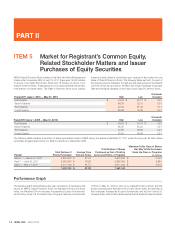
18 NIKE,INC.-Form10-K
PARTII
ITEM7Management’s Discussion and Analysis of Financial Condition and Results of Operations
Consolidated Operating Results
Revenues
(Inmillions)
Fiscal2011 Fiscal2010
FY11vs. FY10
%Change
FY11 vs. FY10
%Change Excluding
Currency Changes
(1) Fiscal2009
FY10vs. FY09
%Change
FY10 vs. FY09
%Change Excluding
Currency Changes
(1)
Revenues $ 20,862 $ 19,014 10 % 10 % $ 19,176 -1 % -2 %
(1) Results have been restated using constant exchange rates for the comparative period to enhance the visibility of the underlying business trends excluding the impact of foreign currency
exchange rate fluctuations.
Fiscal 2011 Compared to Fiscal 2010
On both a reported and currency neutral basis, revenues for NIKE,Inc. grew
10% for fi scal2011, driven by increases in revenues for both the NIKE Brand
and our Other Businesses. On a currency neutral basis, revenues for the NIKE
Brand increased 10% for fi scal2011, while revenues for our Other Businesses
increased 8%. Excluding the effects of changes in currency exchange rates,
every NIKE Brand geography except Japan delivered higher revenues for
fi scal2011, led by North America, which contributed approximately 5 percentage
points to the NIKE Brand revenue increase. The Emerging Markets and Greater
China contributed approximately 3 and 2 percentage points to the NIKE Brand
revenue growth, respectively.
By product group, NIKE Brand footwear and apparel revenue increased 11%
and 9%, respectively, while NIKE Brand equipment revenues declined 2%
during fi scal2011. Fueling the growth of our NIKE Brand footwear business
was the increased demand in our performance products, including the NIKE
Lunar and Free technologies which are used across multiple categories.
Theincrease in NIKE Brand footwear revenue for fi scal2011 was attributable
to a high single-digit percentage increase in unit sales along with a low single-
digit percentage increase in the average selling price per pair. The increase in
unit sales was primarily driven by double-digit percentage growth in Running,
Men’s Training, Action Sports and Women’s Training products, while the
increase in average selling price per pair was primarily driven by price increases
on selected products and fewer close-outs as a percentage of total sales.
ForNIKE Brand apparel, the increase in revenue for fi scal2011 was primarily
driven by a low double-digit percentage increase in unit sales attributable to
strong category presentations and improved product lines, while the average
selling price per unit was relatively fl at. The increase in unit sales was driven
by increased demand in all key categories.
While wholesale revenues remain the largest component of overall NIKE
Brand revenues, we continue to see growth in revenue through our Direct to
Consumer channels. Our NIKE Brand Direct to Consumer operations include
NIKE owned in-line and factory stores, as well as online sales through NIKE
owned websites. For fi scal2011, Direct to Consumer channels represented
approximately 16% of our total NIKE Brand revenues compared to 15% in
fi scal2010. On a currency neutral basis, Direct to Consumer revenues grew
16% for fi scal2011 as we continue to expand our store network, increase
comparable store sales and build our e-commerce business. Comparable
store sales grew 11% for fi scal2011. Comparable store sales include revenues
from NIKE owned in-line and factory stores for which all three of the following
requirements have been met: the store has been open at least oneyear, square
footage has not changed by more than 15% within the pastyear, and the store
has not been permanently repositioned within the pastyear.
Revenues for our Other Businesses consist of results from our affi liate brands;
Cole Haan, Converse, Hurley and Umbro; and NIKE Golf. Excluding the impact
of currency changes, revenues for these businesses increased by 8% in
fi scal2011, refl ecting double-digit percentage revenue growth at Converse,
Cole Haan and Hurley, and a low single-digit growth at Umbro, which more
than offset a mid single-digit revenue decline at NIKE Golf.
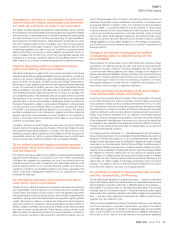
Fiscal 2010 Compared to Fiscal 2009
Excluding the effects of changes in currency exchange rates, revenues for
NIKE,Inc. declined 2%, driven primarily by a 2% decline in revenues for the
NIKE Brand. All of our geographies delivered lower revenues with the exception
of Emerging Markets, refl ecting a challenging economic environment across
most markets, most notably in our Western Europe and Central& Eastern
Europe geographies. By product group, revenues for our worldwide NIKE Brand
footwear business were down 1% compared to the prioryear. Worldwide NIKE
Brand apparel and equipment revenues declined 5% and 7%, respectively.
Our Direct to Consumer operations represented approximately 15% of our
total NIKE Brand revenues in fi scal2010 as compared to 13% in fi scal2009.
Excluding the impact of currency changes, revenues for our Other Businesses
increased by 4% for fi scal2010, driven by increased revenues at Converse,
Umbro and Hurley, which more than offset revenue declines at NIKE Golf
and Cole Haan.
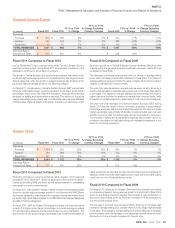
Futures Orders
Futures and advance orders for NIKE Brand footwear and apparel scheduled
for delivery from Junethrough November2011 were 15% higher than the
orders reported for the comparable prioryear period. This futures and advance
order amount is calculated based upon our forecast of the actual exchange
rates under which our revenues will be translated during this period, which
approximate current spot rates.Excluding the impact of currency changes,
futures orders increased 12%, primarily driven by a high single-digit percentage
increase in unit sales volume and a low single-digit percentage increase in
average price per unit for both footwear and apparel products.
By geography, futures orders growth was as follows:
Reported Futures
Orders Growth
Futures Orders Excluding
Currency Changes
(1)
North America +14 % +14 %
Western Europe +11 % +1 %
Central& Eastern Europe +13 % +10 %
Greater China +24 % +17 %
Japan -13 % -6 %
Emerging Markets +25 % +23 %
Total NIKE Brand Futures Orders +15 % +12 %
(1) Growth rates have been restated using constant exchange rates for the comparative period to enhance the visibility of the underlying business trends excluding the impact of foreign currency
exchange rate fluctuations.