Nike 2011 Annual Report Download - page 15
Download and view the complete annual report
Please find page 15 of the 2011 Nike annual report below. You can navigate through the pages in the report by either clicking on the pages listed below, or by using the keyword search tool below to find specific information within the annual report.-
 1
1 -
2
-
3
-
4
-
 5
5 -
 6
6 -
 7
7 -
 8
8 -
 9
9 -
 10
10 -
 11
11 -
 12
12 -
 13
13 -
 14
14 -
 15
15 -
 16
16 -
 17
17 -
 18
18 -
 19
19 -
 20
20 -
 21
21 -
 22
22 -
 23
23 -
 24
24 -
 25
25 -
26
-
27
-
28
-
29
-
30
-
31
-
32
-
33
-
34
-
35
-
36
-
37
-
38
-
39
-
40
-
41
-
42
-
43
-
44
-
45
-
46
-
47
-
48
-
49
-
50
-
51
-
52
-
53
-
54
-
55
-
56
-
57
-
58
-
59
-
60
-
61
-
62
-
63
-
64
-
65
-
66
-
67
-
68
 |
 |
15NIKE,INC.-Form10-K
PARTII
ITEM5Market for Registrant’s Common Equity, Related Stockholder Matters and Issuer Purchases of Equity Securities
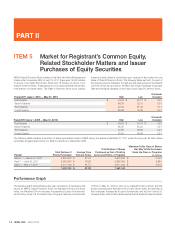
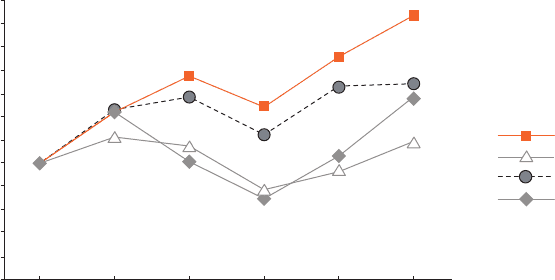
COMPARISON OF 5-YEAR CUMULATIVE TOTAL RETURN AMONG NIKE, INC.; S&P 500 INDEX; S&P APPAREL, ACCESSORIES&
LUXURY GOODS INDEX; AND THE DOW JONES U.S. FOOTWEAR INDEX
2006 20112010200920082007
$200
$220
$240
$180
$160
$140
$120
$100
$80
$60
$40
$20
$0
NIKE, Inc.
S&P 500 APPAREL, ACCESSORIES & LUXURY GOODS INDEX
DOW JONES US FOOTWEAR INDEX
S&P 500, INDEX - TOTAL RETURNS
The Dow Jones U.S. Footwear Index consists of NIKE, Deckers Outdoor
Corp., Timberland Co., Wolverine World Wide,Inc., Iconix Brand GroupInc.,
and Skechers US,Inc. Because NIKE is part of the Dow Jones U.S. Footwear
Index, the price and returns of NIKE stock have a substantial effect on this
index. The Standard& Poor’s Apparel, Accessories& Luxury Goods Index
consists of VF Corp., Coach,Inc., and Polo Ralph Lauren Corporation.
TheDowJones U.S. Footwear Index and the Standard& Poor’s Apparel,
Accessories, and Luxury Goods Index include companies in two major lines
of business in which the Company competes. The indices do not encompass
all of the Company’s competitors, nor all product categories and lines of
business in which the Company is engaged.
The stock performance shown on the performance graph above is not
necessarily indicative of future performance. The Company will not make nor
endorse any predictions as to future stock performance.
The performance graph above is being furnished solely to accompany this
Report pursuant to Item201(e) of Regulation S-K, and is not being fi led for
purposes of Section18 of the Securities Exchange Act of 1934, as amended,
and is not to be incorporated by reference into any fi ling of the Company,
whether made before or after the date hereof, regardless of any general
incorporation language in such fi ling.