Nike 2011 Annual Report Download - page 37
Download and view the complete annual report
Please find page 37 of the 2011 Nike annual report below. You can navigate through the pages in the report by either clicking on the pages listed below, or by using the keyword search tool below to find specific information within the annual report.-
 1
1 -
2
-
3
-
4
-
5
-
6
-
7
-
8
-
9
-
10
-
11
-
12
-
13
-
14
-
15
-
16
-
17
-
18
-
19
-
20
-
21
-
22
-
23
-
24
-
25
-
26
-
 27
27 -
 28
28 -
 29
29 -
 30
30 -
 31
31 -
 32
32 -
 33
33 -
 34
34 -
 35
35 -
 36
36 -
 37
37 -
 38
38 -
 39
39 -
 40
40 -
 41
41 -
 42
42 -
 43
43 -
 44
44 -
 45
45 -
 46
46 -
 47
47 -
48
-
49
-
50
-
51
-
52
-
53
-
54
-
55
-
56
-
57
-
58
-
59
-
60
-
61
-
62
-
63
-
64
-
65
-
66
-
67
-
68
 |
 |

37NIKE,INC.-Form10-K
PARTII
ITEM8Financial Statements and Supplemental Data
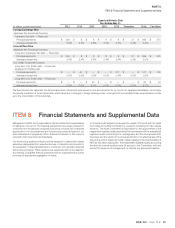
Consolidated Statements of Cash Flows
(Inmillions)
Year Ended May31,
2011 2010 2009
Cash provided by operations:
Net income $ 2,133 $ 1,907 $ 1,487
Income charges (credits) not affecting cash:
Depreciation 335 324 335
Deferred income taxes (76) 8 (294)
Stock-based compensation (Note11) 105 159 171
Impairment of goodwill, intangibles and other assets (Note4) — — 401
Amortization and other 23 72 48
Changes in certain working capital components and other assets and liabilities
excluding the impact of acquisition and divestitures:
(Increase) decrease in accounts receivable (273) 182 (238)
(Increase) decrease in inventories (551) 285 32
(Increase) decrease in prepaid expenses and other current assets (35) (70) 14
Increase (decrease) in accounts payable, accrued liabilities and income taxes payable 151 297 (220)
Cash provided by operations 1,812 3,164 1,736
Cash used by investing activities:
Purchases of short-term investments (7,616) (3,724) (2,909)
Maturities of short-term investments 4,313 2,334 1,280
Sales of short-term investments 2,766 453 1,110
Additions to property, plant and equipment (432) (335) (456)
Disposals of property, plant and equipment 1 10 33
Increase in other assets, net of other liabilities (30) (11) (47)
Settlement of net investment hedges (23) 5 191
Cash used by investing activities (1,021) (1,268) (798)
Cash used by fi nancing activities:
Reductions in long-term debt, including current portion (8) (32) (7)
Increase (decrease) in notes payable 41 (205) 177
Proceeds from exercise of stock options and other stock issuances 345 364 187
Excess tax benefi ts from share-based payment arrangements 64 58 25
Repurchase of common stock (1,859) (741) (649)
Dividends— common and preferred (555) (505) (467)
Cash used by fi nancing activities (1,972) (1,061) (734)
Effect of exchange rate changes 57 (47) (47)
Net (decrease) increase in cash and equivalents (1,124) 788 157
Cash and equivalents, beginning of year 3,079 2,291 2,134
CASH AND EQUIVALENTS, END OF YEAR $ 1,955 $ 3,079 $ 2,291
Supplemental disclosure of cash fl ow information:
Cash paid during the year for:
Interest, net of capitalized interest $ 32 $ 48 $ 47
Income taxes 736 537 765
Dividends declared and not paid 145 131 121
The accompanying notes to consolidated financial statements are an integral part of this statement.