Nike 2011 Annual Report Download - page 25
Download and view the complete annual report
Please find page 25 of the 2011 Nike annual report below. You can navigate through the pages in the report by either clicking on the pages listed below, or by using the keyword search tool below to find specific information within the annual report.-
 1
1 -
2
-
3
-
4
-
5
-
6
-
7
-
8
-
9
-
10
-
11
-
12
-
13
-
14
-
 15
15 -
 16
16 -
 17
17 -
 18
18 -
 19
19 -
 20
20 -
 21
21 -
 22
22 -
 23
23 -
 24
24 -
 25
25 -
 26
26 -
 27
27 -
 28
28 -
 29
29 -
 30
30 -
 31
31 -
 32
32 -
 33
33 -
 34
34 -
 35
35 -
36
-
37
-
38
-
39
-
40
-
41
-
42
-
43
-
44
-
45
-
46
-
47
-
48
-
49
-
50
-
51
-
52
-
53
-
54
-
55
-
56
-
57
-
58
-
59
-
60
-
61
-
62
-
63
-
64
-
65
-
66
-
67
-
68
 |
 |

25NIKE,INC.-Form10-K
PARTII
ITEM7Management’s Discussion and Analysis of Financial Condition and Results of Operations
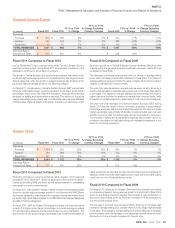
Global Brand Divisions
(Inmillions)
Fiscal2011 Fiscal2010
FY11
vs. FY10
%Change
FY11vs. FY10
%Change Excluding
Currency Changes Fiscal2009
FY10
vs. FY09
%Change
FY10vs. FY09
%Change Excluding
Currency Changes
Revenues $ 123 $ 105 17 % 21 % $ 96 9 % 12 %
(Loss) Before Interest
and Taxes (998 ) (867 ) -15 % ( 811 ) -7 %
Global Brand Divisions primarily represent demand creation and operating
overhead expenses that are centrally managed for the NIKE Brand. Revenues for
the Global Brand Divisions are attributable to NIKE Brand licensing businesses
that are not part of a geographic operating segment.
Fiscal 2011 Compared to Fiscal 2010
For fi scal2011, the increase in Global Brand Division expense was primarily
due to an increase in both operating overhead and centrally managed demand
creation expense. The increase in operating overhead expense was mainly
driven by increased investments in our Direct to Consumer infrastructure
along with higher wages and travel expense. The increase in demand creation
expense was primarily driven by a higher level of brand event spending around
the World Cup and World Basketball Festival in the fi rst half of fi scal2011, as
well as increased investments in sports marketing.
Fiscal 2010 Compared to Fiscal 2009
For fi scal2010, the increase in Global Brand Division expense was largely
due to increases in centrally managed demand creation expense and
performance-based compensation, which more than offset an increase in
licensing revenues. The increase in demand creation expense was primarily
driven by the centralization of certain marketing production costs.
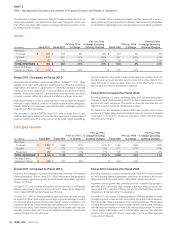
Other Businesses
(Inmillions)
Fiscal2011 Fiscal2010
FY11vs. FY10
%Change
FY11vs. FY10
%Change Excluding
Currency Changes Fiscal2009
FY10vs. FY09
%Change
FY10vs. FY09
%Change Excluding
Currency Changes
Revenues
Converse $ 1,130 $ 983 15 % 15 % $ 915 7 % 7 %
NIKE Golf 623 638 -2 % -4 % 648 -2 % -4 %
Cole Haan 518 463 12 % 12 % 472 -2 % -2 %
Hurley 252 221 14 % 14 % 203 9 % 9 %
Umbro 224 225 0 % 2 % 174 29 % 30 %
Other — — — — 7 — —
TOTAL REVENUES $ 2,747 $ 2,530 9 % 8 % $ 2,419 5 % 4 %
Earnings Before
Interest and Taxes $ 334 $ 299 12 % $ (193 ) —
Fiscal 2011 Compared to Fiscal 2010
Our Other Businesses are comprised of our affi liate brands; Cole Haan,
Converse, Hurley and Umbro; and NIKE Golf. The revenue growth at Converse
was primarily driven by increased licensing revenue in China, as well as
increased sales in the U.K. as we transitioned that market to a Converse
owned distribution model. Revenues for Cole Haan increased 12%, driven
by double-digit percentage growth in our wholesale operations as well as
high single-digit percentage growth in our Direct to Consumer operations.
Revenues declined at NIKE Golf, where we experienced signifi cant erosion
in our Japan business following the earthquake and tsunami in March2011.
For fi scal2011, EBIT for our Other Businesses grew at a faster rate than
revenues, primarily as a result of more favorable foreign currency exchange
impacts. The gross margin percentage remained relatively fl at for fi scal2011,
as the favorable impact from improved product mix was offset by a lower mix
of licensee revenues. Selling and administrative expense as a percentage of
revenues remained relatively fl at for fi scal2011.
Fiscal 2010 Compared to Fiscal 2009
For fi scal2010, the increase in Other Businesses’ revenue was primarily
driven by revenue growth at Converse, Umbro and Hurley, which more than
offset the declines at NIKE Golf and Cole Haan due to reductions in consumer
discretionary spending in their respective markets.
In fi scal2009, EBIT for our Other Businesses included a $401million pre-
tax non-cash charge relating to the impairment of goodwill, intangible and
other assets of Umbro. Excluding this impairment charge, EBIT for our Other
Businesses would have increased 43%, as a result of higher revenues, improved
gross margins across most businesses, and lower demand creation spending.
For additional information about our impairment charges, see Note4—
Identifi able Intangible Assets, Goodwill and Umbro Impairment in the Notes
to the Consolidated Financial Statements.
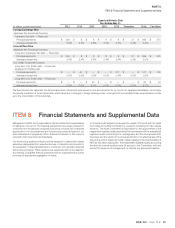
Corporate
(Inmillions)
Fiscal2011 Fiscal2010
FY11vs. FY10
%Change Fiscal2009
FY10vs. FY09
%Change
Revenues $ 11 $ (25 ) — $ — —
(Loss) Before Interest and Taxes (771 ) (894 ) 14 % (955 ) 6 %
Corporate consists largely of unallocated general and administrative expenses,
which includes expenses associated with centrally managed departments,
depreciation and amortization related to our corporate headquarters, unallocated
insurance, benefi t and compensation programs, including stock-based
compensation, certain foreign currency gains and losses, including certain
hedge gains and losses, corporate eliminations and other items.