Nike 2011 Annual Report Download - page 23
Download and view the complete annual report
Please find page 23 of the 2011 Nike annual report below. You can navigate through the pages in the report by either clicking on the pages listed below, or by using the keyword search tool below to find specific information within the annual report.-
 1
1 -
2
-
3
-
4
-
5
-
6
-
7
-
8
-
9
-
10
-
11
-
12
-
 13
13 -
 14
14 -
 15
15 -
 16
16 -
 17
17 -
 18
18 -
 19
19 -
 20
20 -
 21
21 -
 22
22 -
 23
23 -
 24
24 -
 25
25 -
 26
26 -
 27
27 -
 28
28 -
 29
29 -
 30
30 -
 31
31 -
 32
32 -
 33
33 -
34
-
35
-
36
-
37
-
38
-
39
-
40
-
41
-
42
-
43
-
44
-
45
-
46
-
47
-
48
-
49
-
50
-
51
-
52
-
53
-
54
-
55
-
56
-
57
-
58
-
59
-
60
-
61
-
62
-
63
-
64
-
65
-
66
-
67
-
68
 |
 |

23NIKE,INC.-Form10-K
PARTII
ITEM7Management’s Discussion and Analysis of Financial Condition and Results of Operations
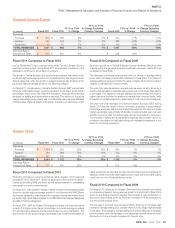
Central& Eastern Europe
(Inmillions)
Fiscal2011 Fiscal2010
FY11vs. FY10
% Change
FY11vs. FY10
%Change Excluding
Currency Changes Fiscal2009
FY10vs. FY09
% Change
FY10vs. FY09
%Change Excluding
Currency Changes
Revenues
Footwear $ 600 $ 558 8 % 11 % $ 673 -17 % -16 %
Apparel 356 354 1 % 4 % 468 -24 % -24 %
Equipment 75 81 -7 % -5 % 106 -24 % -21 %
TOTAL REVENUES $ 1,031 $ 993 4 % 7 % $ 1,247 -20 % -19 %
Earnings Before
Interest and Taxes $ 233 $ 253 -8 % $ 394 -36 %
Fiscal 2011 Compared to Fiscal 2010
Led by Russia and Turkey, most territories within Central& Eastern Europe
reported revenue growth during fi scal2011 as economic conditions in the
geography continued to show signs of recovery.
The growth in Central& Eastern Europe’s footwear revenues was mainly driven
by double-digit percentage growth in our Football (Soccer), Running and Action
Sports categories, while the growth in apparel revenues was primarily driven
by double-digit percentage growth in our Running category.
For fi scal2011, the decrease in Central& Eastern Europe’s EBIT was primarily
driven by unfavorable foreign currency translation and a lower gross margin
percentage, which more than offset the increase in revenues and improved
leverage on selling and administrative expense. The decline in the gross
margin percentage was primarily due to unfavorableyear-over-year standard
currency rates, higher air freight costs and an increase in product input costs.
Fiscal 2010 Compared to Fiscal 2009
Economic conditions in Central& Eastern Europe remained diffi cult as most
markets within the geography experienced lower revenues in fi scal2010 as
compared to fi scal2009.
The decrease in footwear revenue was due to a decline in average selling
price, while unit sales remained fl at compared to fi scal2009. The decline in
average selling price was primarily the result of higher discounts provided to
retailers to manage their inventory levels.
Theyear-over-year decrease in apparel revenue was primarily driven by a
double-digit decrease in average selling price and a mid single-digit decline
in unit sales. The decline in average selling price was primarily the result of
higher discounts provided to retailers to manage their inventory levels, while
the decline in unit sales was due to lower sales in most key product categories.
Theyear-over-year decrease in Central& Eastern Europe’s EBIT during
fi scal2010 was the result of lower revenues, a decline in gross margin
percentage and higher selling and administrative expense. The decline in gross
margin percentage was primarily attributable to less favorableyear-over-year
standard currency rates, as well as higher discounts provided to customers.
The increase in selling and administrative expense was primarily due to an
increase in the reserve for bad debts along with increased investments in our
Direct to Consumer operations.
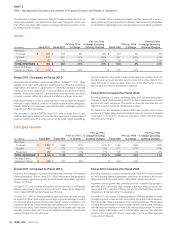
Greater China
(Inmillions)
Fiscal2011 Fiscal2010
FY11vs. FY10
%Change
FY11vs. FY10
%Change Excluding
Currency Changes Fiscal2009
FY10vs. FY09
%Change
FY10vs. FY09
%Change Excluding
Currency Changes
Revenues
Footwear $ 1,164 $ 953 22 % 19 % $ 940 1 % 1 %
Apparel 789 684 15 % 13 % 700 -2 % -3 %
Equipment 107 105 2 % 0 % 103 2 % 0 %
TOTAL REVENUES $ 2,060 $ 1,742 18 % 16 % $ 1,743 0 % 0 %
Earnings Before
Interest and Taxes $ 777 $ 637 22 % $ 575 11 %
Fiscal 2011 Compared to Fiscal 2010
Excluding changes in currency exchange rates, Greater China revenues
increased 16% for fi scal2011, driven by expansion in the number of partner-
owned stores selling NIKE products, as well as improvement in comparable
store sales for partner-owned stores.
For fi scal2011, the increase in Greater China’s footwear revenue was primarily
driven by double-digit percentage growth in our Running and NIKE Brand
Sportswear categories, while the growth in apparel revenue was mainly driven
by double-digit percentage increases in our NIKE Brand Sportswear, Basketball
and Men’s Training categories.
For fi scal2011, EBIT for Greater China grew at a faster rate than revenue as
a result of a higher gross margin percentage, improved leverage on selling
and administrative expense and favorable foreign currency translation. The
improvement in the gross margin percentage was primarily attributable to
higher product prices, favorable product mix and lower inventory obsolescence
expense, which more than offset higher product input costs and warehousing
costs from our new China distribution center.
Fiscal 2010 Compared to Fiscal 2009
For fi scal2010, revenues for Greater China were fl at, primarily attributable
to comparisons against strong revenue growth in the fi rst half of fi scal2009
driven by the Beijing Olympics. Greater China began to gain momentum in
the second half of fi scal2010, as revenues increased 11% as compared to
the second half of fi scal2009.
The increase in footwear revenue was primarily driven by a mid single-digit
increase in average selling price, partially offset by a mid single-digit decrease
in unit sales. The increase in average selling price was primarily due to strategic
price increases, while the decrease in unit sales was primarily driven by lower
discounts on in-line products compared to the prioryear.