Nike 2011 Annual Report Download - page 20
Download and view the complete annual report
Please find page 20 of the 2011 Nike annual report below. You can navigate through the pages in the report by either clicking on the pages listed below, or by using the keyword search tool below to find specific information within the annual report.-
 1
1 -
2
-
3
-
4
-
5
-
6
-
7
-
8
-
9
-
 10
10 -
 11
11 -
 12
12 -
 13
13 -
 14
14 -
 15
15 -
 16
16 -
 17
17 -
 18
18 -
 19
19 -
 20
20 -
 21
21 -
 22
22 -
 23
23 -
 24
24 -
 25
25 -
 26
26 -
 27
27 -
 28
28 -
 29
29 -
 30
30 -
31
-
32
-
33
-
34
-
35
-
36
-
37
-
38
-
39
-
40
-
41
-
42
-
43
-
44
-
45
-
46
-
47
-
48
-
49
-
50
-
51
-
52
-
53
-
54
-
55
-
56
-
57
-
58
-
59
-
60
-
61
-
62
-
63
-
64
-
65
-
66
-
67
-
68
 |
 |

20 NIKE,INC.-Form10-K
PARTII
ITEM7Management’s Discussion and Analysis of Financial Condition and Results of Operations
Restructuring Charges
During fi scal2009, we restructured the organization to streamline our
management structure, enhance consumer focus, drive innovation more
quickly to market and establish a more scalable cost structure. As a result of
these actions, we reduced our global workforce by approximately 5% and
incurred pre-tax restructuring charges of $195million in fi scal2009, primarily
consisting of cash severance costs. These charges are included in “Corporate”
for segment reporting purposes.
Goodwill, Intangibles and Other Assets
Impairment
In fi scal2009, we recognized non-cash impairment charges of $199million
and $202million relating to Umbro’s goodwill, intangibles and other assets,
respectively. Although Umbro’s fi nancial performance for fi scal2009 was
slightly better than we had originally expected, projected future cash fl ows
had fallen below the levels we expected at the time of acquisition. This erosion
was a result of both the unprecedented decline in global consumer markets,
particularly in the United Kingdom, and our decision to adjust the level of
investment in the business.
For additional information about our impairment charges, see Note4 –
Acquisition, Identifi able Intangible Assets, Goodwill and Umbro Impairment in
the accompanying Notes to the Consolidated Financial Statements.
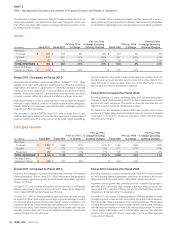
Other (Income), net
(Inmillions)
Fiscal2011 Fiscal2010
FY11vs. FY10
%Change Fiscal2009
FY10vs. FY09
%Change
Other (income), net $ (33 ) $ (49 ) -33 % $ (89 ) -45 %
Fiscal 2011 Compared to Fiscal 2010
Other (income), net is comprised of foreign currency conversion gains and losses
from the re-measurement of monetary assets and liabilities in non-functional
currencies and the impact of certain foreign currency derivative instruments,
as well as unusual or non-recurring transactions that are outside the normal
course of business. For fi scal2011, other (income), net was primarily comprised
of net foreign currency gains.
For fi scal2011, we estimate that the combination of translation of foreign
currency-denominated profi ts from our international businesses and theyear-
over-year change in foreign currency related net gains included in other
(income), net had an unfavorable impact of approximately $33million on our
income before income taxes.
Fiscal 2010 Compared to Fiscal 2009
For fi scal2010 and 2009, other (income), net was primarily comprised of net
foreign currency gains and the recognition of previously deferred licensing
income related to our fi scal2008 sale of NIKE Bauer Hockey.
For fi scal2010, we estimate that the combination of translation of foreign
currency-denominated profi ts from our international businesses and theyear-
over-year change in foreign currency related net gains included in other (income),
net increased our income before income taxes by approximately $34million.
Income Taxes
Fiscal2011 Fiscal2010
FY11vs. FY10
%Change Fiscal2009
FY10vs. FY09
%Change
Effective tax rate 25.0 % 24.2 % 80 bps 24.0 % 20 bps
Fiscal 2011 Compared to Fiscal 2010
Our effective tax rate for fi scal2011 was 80 basis points higher than the
effective rate for fi scal2010 due primarily to the change in geographic mix of
earnings. A larger percentage of our earnings in fi scal2011 were attributable
to operations in the U.S., where the statutory tax rate is generally higher than
the tax rate on operations outside of the U.S. This impact was partially offset
by changes to uncertain tax positions.
Fiscal 2010 Compared to Fiscal 2009
Our effective tax rate for fi scal2010 was 20 basis points higher than the
effective rate for fi scal2009. Our effective tax rate for fi scal2009 includes a
tax benefi t related to charges recorded for the impairment of Umbro’s goodwill,
intangible and other assets. Excluding this tax benefi t, our effective rate for
fi scal2009 would have been 26.5%, 230 basis points higher than our effective
tax rate for fi scal2010. The decrease in our effective tax rate for fi scal2010
was primarily attributable to our international operations, as tax rates for these
operations are generally lower than the U.S. statutory rate.
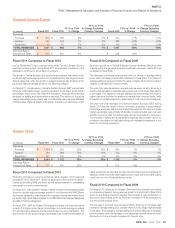
Operating Segments
The Company’s reportable operating segments are based on our internal
geographic organization. Each NIKE Brand geography operates predominantly in
one industry: the design, development, marketing and selling of athletic footwear,
apparel, and equipment. Our reportable operating segments for the NIKE Brand
are: North America, Western Europe, Central& Eastern Europe, Greater China,
Japan, and Emerging Markets. Our NIKE Brand Direct to Consumer operations
are managed within each geographic segment.
As part of our centrally managed foreign exchange risk management program,
standard foreign currency rates are assigned to each NIKE Brand entity in our
geographic operating segments and are used to record any non-functional
currency revenues or product purchases into the entity’s functional currency.
Geographic operating segment revenues and cost of sales refl ect use of these
standard rates. For all NIKE Brand operating segments, differences between
assigned standard foreign currency rates and actual market rates are included
in Corporate together with foreign currency hedge gains and losses generated
from our centrally managed foreign exchange risk management program. Prior
to fi scal2010, all foreign currency results, including hedge results and other
conversion gains and losses generated by the Western Europe and Central&
Eastern Europe geographies were recorded in their respective geographic results.
Certain prioryear amounts have been reclassifi ed to conform to fi scal2011
presentation, as South Africa became part of the Emerging Markets operating
segment beginning June1,2010. Previously, South Africa was part of the
Central& Eastern Europe operating segment.