Proctor and Gamble 2014 Annual Report Download - page 2
Download and view the complete annual report
Please find page 2 of the 2014 Proctor and Gamble annual report below. You can navigate through the pages in the report by either clicking on the pages listed below, or by using the keyword search tool below to find specific information within the annual report.-
 1
1 -
 2
2 -
 3
3 -
 4
4 -
 5
5 -
 6
6 -
 7
7 -
 8
8 -
 9
9 -
 10
10 -
 11
11 -
 12
12 -
 13
13 -
14
-
15
-
16
-
17
-
18
-
19
-
20
-
21
-
22
-
23
-
24
-
25
-
26
-
27
-
28
-
29
-
30
-
31
-
32
-
33
-
34
-
35
-
36
-
37
-
38
-
39
-
40
-
41
-
42
-
43
-
44
-
45
-
46
-
47
-
48
-
49
-
50
-
51
-
52
-
53
-
54
-
55
-
56
-
57
-
58
-
59
-
60
-
61
-
62
-
63
-
64
-
65
-
66
-
67
-
68
-
69
-
70
-
71
-
72
-
73
-
74
-
75
-
76
-
77
-
78
-
79
-
80
-
81
-
82
-
83
-
84
-
85
-
86
-
87
-
88
-
89
-
90
-
91
-
92
-
93
-
94
 |
 |

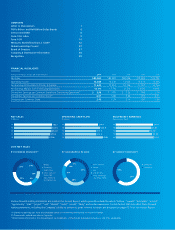
FINANCIAL HIGHLIGHTS
(unaudited)
Amounts in millions, except per share amounts 2014 2013 2012 2011 2010
Net Sales $83,062 $82,581 $82,006 $79,385 $75,785
Operating Income 15,288 14,330 13,035 15,233 15,306
Net Earnings Attributable to Procter & Gamble 11,643 11,312 10,756 11,797 12,736
Net Earnings Margin from Continuing Operations 14.1% 13.7% 11.2% 14.5% 14.0%
Diluted Net Earnings per Common Share from Continuing Operations(1) $ 3.98 $ 3.83 $ 3.06 $ 3.80 $ 3.38
Diluted Net Earnings per Common Share(1) 4.01 3.86 3.66 3.93 4.11
Dividends per Common Share 2.45 2.29 2.14 1.97 1.80
CONTENTS
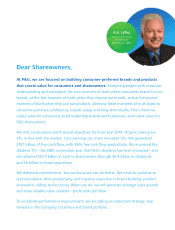
Letter to Shareowners 1
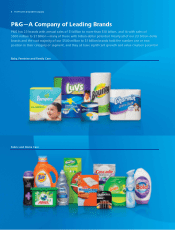
P&G’s Billion- and Half-Billion-Dollar Brands 6
Sectors and SMOs 8
Form 10-K Index 9
Form 10-K 10
Measures Not Defi ned by U.S. GAAP 42
Global Leadership Council 87
Board of Directors 87
Company & Shareowner Information 88
Recognition 89
NET SALES
($ billions)
OPERATING CASH FLOW
($ billions)
DILUTED NET EARNINGS
(per common share)
.
.
.
.
.
.
.
.
.
.
.
.
.
.
.
() Diluted net earnings per share are calculated based on net earnings attributable to Procter & Gamble.
() These results exclude net sales in Corporate.
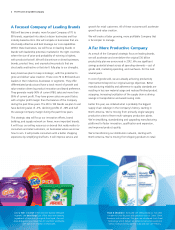
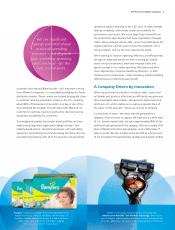
* Brand names referenced in this Annual Report are trademarks of The Procter & Gamble Company or one of its subsidiaries.
Various forward-looking statements are made in this Annual Report, which generally include the words “believe,” “expect,” “anticipate,” “intend,”
“opportunity,” “plan,” “project,” “will,” “should,” “could,” “would,” “likely,” and similar expressions. Certain factors that may affect these forward-
looking statements, including the Company’s ability to achieve its goals referred to herein, are discussed on pages
–
of this Annual Report.
BY BUSINESS SEGMENT() BY GEOGRAPHIC REGION BY MARKET MATURITY
NET SALES
Developed
Developing
Beauty
Grooming
Health Care
Fabric Care and
Home Care
Baby, Feminine
and Family Care
North America
Europe
Asia
Latin America
I ndia, Middle East
and Africa (IMEA)
9%
32%
10%
25% 24% 10%
7%
16%
28%
39% 39%
61%