Proctor and Gamble 2014 Annual Report Download - page 37
Download and view the complete annual report
Please find page 37 of the 2014 Proctor and Gamble annual report below. You can navigate through the pages in the report by either clicking on the pages listed below, or by using the keyword search tool below to find specific information within the annual report.-
 1
1 -
2
-
3
-
4
-
5
-
6
-
7
-
8
-
9
-
10
-
11
-
12
-
13
-
14
-
15
-
16
-
17
-
18
-
19
-
20
-
21
-
22
-
23
-
24
-
25
-
26
-
 27
27 -
 28
28 -
 29
29 -
 30
30 -
 31
31 -
 32
32 -
 33
33 -
 34
34 -
 35
35 -
 36
36 -
 37
37 -
 38
38 -
 39
39 -
 40
40 -
 41
41 -
 42
42 -
 43
43 -
 44
44 -
 45
45 -
 46
46 -
 47
47 -
48
-
49
-
50
-
51
-
52
-
53
-
54
-
55
-
56
-
57
-
58
-
59
-
60
-
61
-
62
-
63
-
64
-
65
-
66
-
67
-
68
-
69
-
70
-
71
-
72
-
73
-
74
-
75
-
76
-
77
-
78
-
79
-
80
-
81
-
82
-
83
-
84
-
85
-
86
-
87
-
88
-
89
-
90
-
91
-
92
-
93
-
94
 |
 |
The Procter & Gamble Company 35
certain balance sheet impacts from significant foreign
exchange devaluations; and certain restructuring-type
activities to maintain a competitive cost structure, including
manufacturing and workforce optimization. Corporate also
includes reconciling items to adjust the accounting policies
used in the segments to U.S. GAAP. The most significant
reconciling item includes income taxes to adjust from
blended statutory tax rates that are reflected in the segments
to the overall Company effective tax rate.
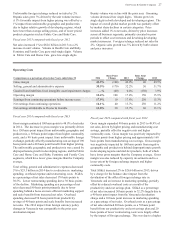
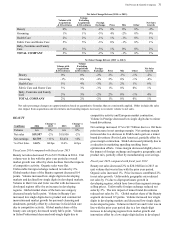
Net sales in Corporate increased by $176 million in 2014.
Corporate net earnings improved by $191 million in 2014
primarily due to reduced net after-tax goodwill and
intangible asset impairment charges (which totaled $290
million in the prior year but were zero in the current period),
lower current year restructuring and overhead spending and
lower overall Company effective tax rate, partially offset by
the holding gain in the prior year from the buyout of our
Iberian joint venture partner. Additional discussion of the
items impacting net earnings in Corporate are included in the
Results of Operations section.
In 2013, net sales in Corporate decreased by $258 million
due to a reduction in sales from P&G Chemicals as a result
of lower commodity prices. Corporate net earnings
improved $1.6 billion primarily due to reduced net after-tax
goodwill and intangible asset impairment charges (which
totaled $1.5 billion in the prior year as compared to $290
million in the current period), along with the 2013 net after-
tax holding gain related to the purchase of the balance of our
Iberian joint venture, partially offset by the 2013 charge for
the impact of the Venezuela devaluation. Additional
discussion of the items impacting net earnings in Corporate
are included in the Results of Operations section above.
Productivity and Cost Savings Plan
In 2012, the Company initiated a productivity and cost
savings plan to reduce costs and better leverage scale in the
areas of supply chain, research and development, marketing
and overheads. The plan was designed to accelerate cost
reductions by streamlining management decision making,
manufacturing and other work processes to fund the
Company's growth strategy.
As part of this plan, the Company expects to incur in excess
of $4.5 billion in before-tax restructuring costs over a five-
year period (from fiscal 2012 through fiscal 2016).
Approximately 62% of the costs have been incurred through
the end of fiscal 2014. Savings generated from the
restructuring costs are difficult to estimate, given the nature
of the activities, the corollary benefits achieved (e.g.,
enrollment reduction achieved via normal attrition), the
timing of the execution and the degree of reinvestment.
Overall, the costs and other non-manufacturing enrollment
reductions are expected to deliver in excess of $2.8 billion in
annual gross savings (before-tax). The cumulative before-
tax savings realized through 2014 were approximately $1.4
billion.
Restructuring accruals of $381 million as of June 30, 2014,
are classified as current liabilities. Approximately 75% of
the restructuring charges incurred during fiscal 2014 either
have been or will be settled with cash. Consistent with our
historical policies for ongoing restructuring-type activities,
the resulting charges are funded by and included within
Corporate for segment reporting.
Refer to Note 3 to our Consolidated Financial Statements for
more details on the restructuring program.
CASH FLOW, FINANCIAL CONDITION AND
LIQUIDITY
We believe our financial condition continues to be of high
quality, as evidenced by our ability to generate substantial
cash from operations and ready access to capital markets at
competitive rates.
Operating cash flow provides the primary source of cash to
fund operating needs and capital expenditures. Excess
operating cash is used first to fund shareholder dividends.
Other discretionary uses include share repurchases and
acquisitions to complement our portfolio of businesses,
brands and geographies. As necessary, we may supplement
operating cash flow with debt to fund these activities. The
overall cash position of the Company reflects our strong
business results and a global cash management strategy that
takes into account liquidity management, economic factors
and tax considerations.
Operating Cash Flow
Fiscal year 2014 compared with fiscal year 2013
Operating cash flow was $14.0 billion in 2014, a 6%
decrease from the prior year, which was primarily driven by
a $1 billion discretionary contribution into a foreign pension
plan. Operating cash flows resulted primarily from net
earnings, adjusted for non-cash items (depreciation and
amortization, stock-based compensation, deferred income
taxes and gains on sale and purchase of businesses) partially
offset by the impact of other operating assets and liabilities.
Working capital changes did not have a significant impact on
operating cash flow in 2014. Reduced accounts receivable
generated $87 million of cash primarily due to improved
collection results, which, along with the timing and mix of
sales late in the period, drove a 1 day decrease in accounts
receivable days sales outstanding. Inventory changes did not
significantly impact operating cash flow as inventory
management improvement efforts offset inventory needed to
support product initiatives and build stock to support
capacity expansions and manufacturing sourcing changes.
Inventory days on hand decreased by 3 days primarily due to
inventory management improvement efforts. Accounts
payable, accrued and other liabilities also did not
significantly impact operating cash flow. Other operating
assets and liabilities utilized $1.6 billion of cash, primarily
driven by $1 billion of cash used for a discretionary
contribution into a foreign pension plan.