Proctor and Gamble 2014 Annual Report Download - page 77
Download and view the complete annual report
Please find page 77 of the 2014 Proctor and Gamble annual report below. You can navigate through the pages in the report by either clicking on the pages listed below, or by using the keyword search tool below to find specific information within the annual report.-
 1
1 -
2
-
3
-
4
-
5
-
6
-
7
-
8
-
9
-
10
-
11
-
12
-
13
-
14
-
15
-
16
-
17
-
18
-
19
-
20
-
21
-
22
-
23
-
24
-
25
-
26
-
27
-
28
-
29
-
30
-
31
-
32
-
33
-
34
-
35
-
36
-
37
-
38
-
39
-
40
-
41
-
42
-
43
-
44
-
45
-
46
-
47
-
48
-
49
-
50
-
51
-
52
-
53
-
54
-
55
-
56
-
57
-
58
-
59
-
60
-
61
-
62
-
63
-
64
-
65
-
66
-
 67
67 -
 68
68 -
 69
69 -
 70
70 -
 71
71 -
 72
72 -
 73
73 -
 74
74 -
 75
75 -
 76
76 -
 77
77 -
 78
78 -
 79
79 -
 80
80 -
 81
81 -
 82
82 -
 83
83 -
 84
84 -
 85
85 -
 86
86 -
 87
87 -
88
-
89
-
90
-
91
-
92
-
93
-
94
 |
 |

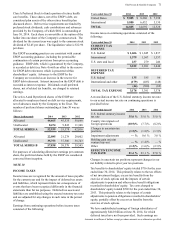
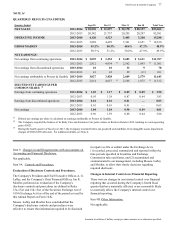
The Procter & Gamble Company 75
Amounts in millions of dollars except per share amounts or as otherwise specified.
Global Segment Results Net Sales
Earnings /
(Loss)
from
Continuing
Operations
Before
Income
Taxes
Net Earnings
/ (Loss) from
Continuing
Operations
Depreciation
and
Amortization
Total
Assets
Capital
Expenditures
BEAUTY 2014 $ 19,507 $ 3,530 $ 2,739 $ 394 $ 8,576 $ 502
2013 19,956 3,215 2,474 375 8,396 541
2012 20,318 3,196 2,390 379 8,357 569
GROOMING 2014 8,009 2,589 1,954 576 23,767 369
2013 8,038 2,458 1,837 603 23,971 378
2012 8,339 2,395 1,807 623 24,518 392
HEALTH CARE 2014 7,798 1,597 1,083 199 5,879 253
2013 7,684 1,582 1,093 191 5,933 248
2012 7,235 1,520 1,022 186 5,832 251
FABRIC CARE AND HOME CARE 2014 26,060 4,678 3,039 625 11,384 1,154
2013 25,862 4,757 3,089 639 11,231 1,064
2012 25,580 4,485 2,816 627 10,647 965
BABY, FEMININE AND FAMILY
CARE 2014 20,950 4,310 2,940 908 10,946 1,317
2013 20,479 4,507 3,047 837 10,926 1,560
2012 19,714 4,271 2,927 753 9,203 1,495
CORPORATE(1) 2014 738 (1,819)(48) 439 83,714 253
2013 562 (1,827)(239) 337 78,806 217
2012 820 (3,339)(1,812) 636 73,687 292
TOTAL COMPANY 2014 83,062 14,885 11,707 3,141 144,266 3,848
2013 82,581 14,692 11,301 2,982 139,263 4,008
2012 82,006 12,528 9,150 3,204 132,244 3,964
(1) The Corporate reportable segment includes depreciation and amortization, total assets and capital expenditures of the Snacks business prior to its
divestiture effective May 31, 2012 and of the Pet Care business.
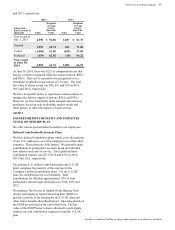
NOTE 13
DISCONTINUED OPERATIONS
On July 31, 2014, the Company completed the divestiture of
its Pet Care operations in North America, Latin America, and
other selected countries to Mars, Incorporated (Mars) for
$2.9 billion in an all-cash transaction. Under the terms of
the agreement, Mars acquired our branded pet care products,
our manufacturing facilities in the United States and the
majority of the employees working in the Pet Care business.
The agreement includes an option for Mars to acquire the
Pet Care business in several additional countries. The one-
time earnings impact from the divestiture is not expected to
be material and will be reflected in fiscal 2015 results. The
European Union countries are not included in the agreement
with Mars. The Company is pursuing alternate plans to sell
its Pet Care business in these markets.
The Pet Care business had historically been part of the
Company’s Health Care reportable segment. In accordance
with applicable accounting guidance for the disposal of
long-lived assets, the results of the Pet Care business are
presented as discontinued operations and, as such, have been
excluded from both continuing operations and segment
results for all periods presented. Additionally, the Pet Care
balance sheet positions as of June 30, 2014 are presented as
assets and liabilities held for sale in the Consolidated
Balance Sheets.
In fiscal 2012, the Company completed the divestiture of our
global Snacks business to The Kellogg Company (Kellogg)
for $2.7 billion of cash. Under the terms of the agreement,
Kellogg acquired our branded snacks products, our
manufacturing facilities in Belgium and the United States
and the majority of the employees working on the snacks
business. The Company recorded an after-tax gain on the
transaction of $1.4 billion, which is included in net earnings
from discontinued operations in the Consolidated Statement
of Earnings for the year ended June 30, 2012.
The Snacks business had historically been part of the
Company's former Snacks and Pet Care reportable segment.
In accordance with the applicable accounting guidance for
the disposal of long-lived assets, the results of the Snacks