Proctor and Gamble 2014 Annual Report Download - page 66
Download and view the complete annual report
Please find page 66 of the 2014 Proctor and Gamble annual report below. You can navigate through the pages in the report by either clicking on the pages listed below, or by using the keyword search tool below to find specific information within the annual report.-
 1
1 -
2
-
3
-
4
-
5
-
6
-
7
-
8
-
9
-
10
-
11
-
12
-
13
-
14
-
15
-
16
-
17
-
18
-
19
-
20
-
21
-
22
-
23
-
24
-
25
-
26
-
27
-
28
-
29
-
30
-
31
-
32
-
33
-
34
-
35
-
36
-
37
-
38
-
39
-
40
-
41
-
42
-
43
-
44
-
45
-
46
-
47
-
48
-
49
-
50
-
51
-
52
-
53
-
54
-
55
-
 56
56 -
 57
57 -
 58
58 -
 59
59 -
 60
60 -
 61
61 -
 62
62 -
 63
63 -
 64
64 -
 65
65 -
 66
66 -
 67
67 -
 68
68 -
 69
69 -
 70
70 -
 71
71 -
 72
72 -
 73
73 -
 74
74 -
 75
75 -
 76
76 -
77
-
78
-
79
-
80
-
81
-
82
-
83
-
84
-
85
-
86
-
87
-
88
-
89
-
90
-
91
-
92
-
93
-
94
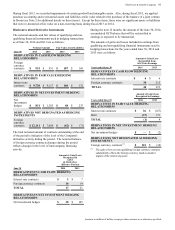
 |
 |

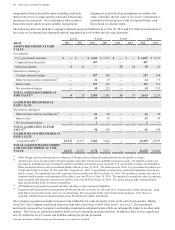
64 The Procter & Gamble Company
Amounts in millions of dollars except per share amounts or as otherwise specified.
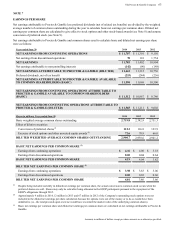
NOTE 8
STOCK-BASED COMPENSATION
We have stock-based compensation plans under which we
annually grant stock option, restricted stock, restricted stock
unit (RSU) and performance stock unit (PSU) awards to key
managers and directors. Exercise prices on options granted
have been, and continue to be, set equal to the market price
of the underlying shares on the date of the grant. Since
September 2002, the key manager stock option awards
granted vest after three years and have a 10-year life. The
key manager stock option awards granted from July 1998
through August 2002 vested after three years and have a 15-
year life. Key managers can elect to receive up to the entire
value of their option award in RSUs. Key manager RSUs
vest and are settled in shares of common stock five years
from the grant date. The awards provided to the Company's
directors are in the form of restricted stock and RSUs.
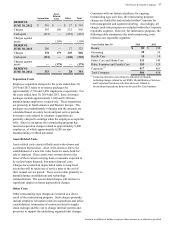
In addition to our key manager and director grants, we make
other minor stock option and RSU grants to employees for
which the terms are not substantially different than those
described in the preceding paragraph. In 2011, we
implemented a performance stock program (PSP) and
granted PSUs to senior level executives. Under this
program, the number of PSUs that will vest three years after
the respective grant date is based on the Company's
performance relative to pre-established performance goals
during that three year period.
A total of 180 million shares of common stock were
authorized for issuance under stock-based compensation
plans approved by shareholders in 2003 and 2009. A total of
27 million shares remain available for grant under the 2003
and 2009 plans.
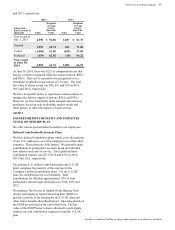
Total stock-based compensation expense for stock option
grants was $246, $249 and $317 for 2014, 2013 and 2012,
respectively. Total compensation expense for restricted
stock, RSUs and PSUs was $114, $97 and $60 in 2014, 2013
and 2012, respectively. The total income tax benefit
recognized in the income statement for stock options,
restricted stock, RSUs and PSUs was $127, $96 and $102 in
2014, 2013 and 2012, respectively.
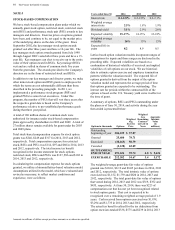
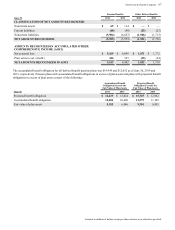
In calculating the compensation expense for stock options
granted, we utilize a binomial lattice-based valuation model.
Assumptions utilized in the model, which are evaluated and
revised as necessary, to reflect market conditions and
experience, were as follows:
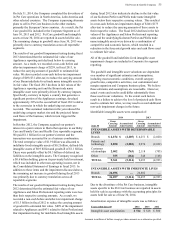
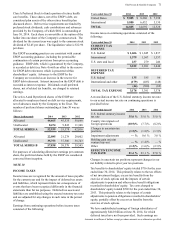
Years ended June 30 2014 2013 2012
Interest rate 0.1-2.8% 0.2-2.0% 0.2-2.1%
Weighted average
interest rate 2.5% 1.8% 1.9%
Dividend yield 3.1% 2.9% 2.6%
Expected volatility 15-17% 14-15% 12-18%
Weighted average
volatility 16% 15% 15%
Expected life in
years 8.2 8.9 8.5
Lattice-based option valuation models incorporate ranges of
assumptions for inputs and those ranges are disclosed in the
preceding table. Expected volatilities are based on a
combination of historical volatility of our stock and implied
volatilities of call options on our stock. We use historical
data to estimate option exercise and employee termination
patterns within the valuation model. The expected life of
options granted is derived from the output of the option
valuation model and represents the average period of time
that options granted are expected to be outstanding. The
interest rate for periods within the contractual life of the
options is based on the U.S. Treasury yield curve in effect at
the time of grant.
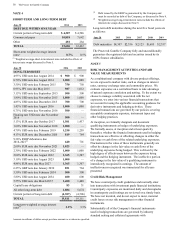
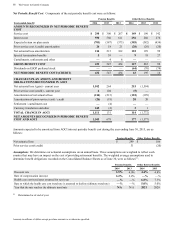
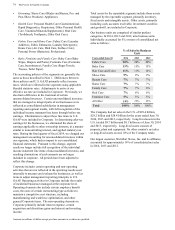
A summary of options, RSUs and PSUs outstanding under
the plans as of June 30, 2014, and activity during the year
then ended is presented below:
Options in thousands Options
Weighted
Avg.
Exercise
Price
Weighted
Avg.
Remaining
Contract-
ual Life in
Years
Aggregate
Intrinsic
Value
(in
millions)
Outstanding,
beginning of year 306,239 $ 57.07
Granted 25,680 78.71
Exercised (38,165) 50.79
Canceled (2,128) 65.09
OUTSTANDING,
END OF YEAR 291,626 59.74 4.8 $ 5,626
EXERCISABLE 212,502 54.67 3.4 5,172
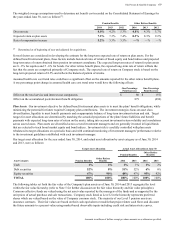
The weighted average grant-date fair value of options
granted was $10.01, $8.19 and $8.05 per share in 2014, 2013
and 2012, respectively. The total intrinsic value of options
exercised was $1,152, $1,759 and $820 in 2014, 2013 and
2012, respectively. The total grant-date fair value of options
that vested during 2014, 2013 and 2012 was $319, $352 and
$435, respectively. At June 30, 2014, there was $223 of
compensation cost that has not yet been recognized related
to stock option grants. That cost is expected to be
recognized over a remaining weighted average period of 1.9
years. Cash received from options exercised was $1,938,
$3,294 and $1,735 in 2014, 2013 and 2012, respectively.
The actual tax benefit realized for the tax deductions from
option exercises totaled $338, $575 and $239 in 2014, 2013