Proctor and Gamble 2014 Annual Report Download - page 29
Download and view the complete annual report
Please find page 29 of the 2014 Proctor and Gamble annual report below. You can navigate through the pages in the report by either clicking on the pages listed below, or by using the keyword search tool below to find specific information within the annual report.-
 1
1 -
2
-
3
-
4
-
5
-
6
-
7
-
8
-
9
-
10
-
11
-
12
-
13
-
14
-
15
-
16
-
17
-
18
-
 19
19 -
 20
20 -
 21
21 -
 22
22 -
 23
23 -
 24
24 -
 25
25 -
 26
26 -
 27
27 -
 28
28 -
 29
29 -
 30
30 -
 31
31 -
 32
32 -
 33
33 -
 34
34 -
 35
35 -
 36
36 -
 37
37 -
 38
38 -
 39
39 -
40
-
41
-
42
-
43
-
44
-
45
-
46
-
47
-
48
-
49
-
50
-
51
-
52
-
53
-
54
-
55
-
56
-
57
-
58
-
59
-
60
-
61
-
62
-
63
-
64
-
65
-
66
-
67
-
68
-
69
-
70
-
71
-
72
-
73
-
74
-
75
-
76
-
77
-
78
-
79
-
80
-
81
-
82
-
83
-
84
-
85
-
86
-
87
-
88
-
89
-
90
-
91
-
92
-
93
-
94
 |
 |

The Procter & Gamble Company 27
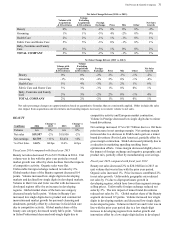
Unfavorable foreign exchange reduced net sales by 2%.
Organic sales grew 3% driven by the unit volume increase.
A 1% favorable impact from higher pricing was offset by a
1% impact from unfavorable geographic and product mix
due to higher relative growth of developing regions, which
have lower than average selling prices, and of lower priced
product categories such as Fabric Care and Baby Care.
Fiscal year 2013 compared with fiscal year 2012
Net sales increased 1% to $82.6 billion in 2013 on a 2%
increase in unit volume. Volume in Health Care and Baby,
Feminine and Family Care grew mid-single digits. Volume
in Fabric Care and Home Care grew low single digits.
Beauty volume was in line with the prior year. Grooming
volume decreased low single digits. Volume grew low
single digits in both developed and developing regions. The
impact of overall global market growth was partially offset
by market share declines in certain categories. Price
increases added 1% to net sales, driven by price increases
across all business segments, primarily executed in prior
periods to offset cost increases and devaluing developing
market currencies. Foreign exchange reduced net sales by
2%. Organic sales growth was 3% driven by both volume
and price increases.
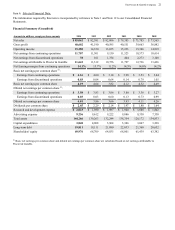
Operating Costs
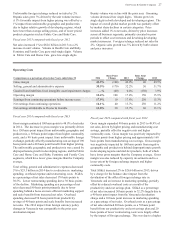
Comparisons as a percentage of net sales; Years ended June 30 2014
Basis Point
Change 2013
Basis Point
Change 2012
Gross margin 48.9% (100) 49.9% 40 49.5%
Selling, general and administrative expense 30.5% (170) 32.2% 50 31.7%
Goodwill and indefinite-lived intangible asset impairment charges —% (40) 0.4% (150) 1.9%
Operating margin 18.4% 100 17.4% 150 15.9%
Earnings from continuing operations before income taxes 17.9% 10 17.8% 250 15.3%
Net earnings from continuing operations 14.1% 40 13.7% 250 11.2%
Net earnings attributable to Procter & Gamble 14.0% 30 13.7% 60 13.1%
Fiscal year 2014 compared with fiscal year 2013
Gross margin contracted 100 basis points to 48.9% of net sales
in 2014. The decrease in gross margin was primarily driven
by a 150 basis point impact from unfavorable geographic and
product mix, a 50 basis point impact from higher commodity
costs, and a 90 basis point impact from unfavorable foreign
exchange, partially offset by manufacturing cost savings of 190
basis points and a 40 basis point benefit from higher pricing.
The unfavorable geographic and product mix was caused by
disproportionate growth in developing regions, and the Fabric
Care and Home Care and Baby, Feminine and Family Care
segments, which have lower gross margins than the Company
average.
Total selling, general and administrative expenses decreased
5% to $25.3 billion in 2014 due to a reduction in marketing
spending, overhead expense and restructuring costs. SG&A
as a percentage of net sales decreased 170 basis points to
30.5%. Lower restructuring spending drove 30 basis points
of the decline. Marketing spending as a percentage of net
sales decreased 80 basis points primarily due to lower
spending behind a focus on more efficient marketing support
and scale benefits from increased net sales. Overhead
spending decreased 50 basis points from productivity
savings of 40 basis points and scale benefits from increased
net sales. The 2014 impact from foreign currency policy
changes in Venezuela was comparable to the prior year
devaluation impact.
Fiscal year 2013 compared with fiscal year 2012
Gross margin expanded 40 basis points in 2013 to 49.9% of
net sales, driven by higher pricing and manufacturing cost
savings, partially offset by negative mix and higher
commodity costs. Gross margin was positively impacted by
70 basis points from higher pricing and approximately 160
basis points from manufacturing cost savings. Gross margin
was negatively impacted by 160 basis points from negative
geographic and product mix behind disproportionate growth
in developing regions and mid-tier products, both of which
have lower gross margins than the Company average. Gross
margin was also reduced by capacity investments and to a
lesser extent by foreign exchange impacts and higher
commodity costs.
Total SG&A increased 2% to $26.6 billion in 2013, driven
by a charge for the balance sheet impact from the
devaluation of the official foreign exchange rate in
Venezuela and an increase in marketing spending, partially
offset by reduced overhead costs as a result of the
productivity and cost savings plan. SG&A as a percentage
of net sales increased 50 basis points to 32.2% largely due to
a 40 basis point impact from the Venezuela devaluation
charge and a 10 basis point increase in marketing spending
as a percentage of net sales. Overhead costs as a percentage
of net sales declined 20 basis points, as a 70 basis point
benefit from our productivity and cost savings plan and 20
basis points of lower restructuring costs were largely offset
by the impact of foreign exchange. This was due to a higher