Proctor and Gamble 2014 Annual Report Download - page 62
Download and view the complete annual report
Please find page 62 of the 2014 Proctor and Gamble annual report below. You can navigate through the pages in the report by either clicking on the pages listed below, or by using the keyword search tool below to find specific information within the annual report.-
 1
1 -
2
-
3
-
4
-
5
-
6
-
7
-
8
-
9
-
10
-
11
-
12
-
13
-
14
-
15
-
16
-
17
-
18
-
19
-
20
-
21
-
22
-
23
-
24
-
25
-
26
-
27
-
28
-
29
-
30
-
31
-
32
-
33
-
34
-
35
-
36
-
37
-
38
-
39
-
40
-
41
-
42
-
43
-
44
-
45
-
46
-
47
-
48
-
49
-
50
-
51
-
 52
52 -
 53
53 -
 54
54 -
 55
55 -
 56
56 -
 57
57 -
 58
58 -
 59
59 -
 60
60 -
 61
61 -
 62
62 -
 63
63 -
 64
64 -
 65
65 -
 66
66 -
 67
67 -
 68
68 -
 69
69 -
 70
70 -
 71
71 -
 72
72 -
73
-
74
-
75
-
76
-
77
-
78
-
79
-
80
-
81
-
82
-
83
-
84
-
85
-
86
-
87
-
88
-
89
-
90
-
91
-
92
-
93
-
94
 |
 |
60 The Procter & Gamble Company
Amounts in millions of dollars except per share amounts or as otherwise specified.
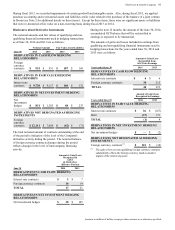
using market-based observable inputs including credit risk,
interest rate curves, foreign currency rates and forward and
spot prices for currencies. In circumstances where market-
based observable inputs are not available, management
judgment is used to develop assumptions to estimate fair
value. Generally, the fair value of our Level 3 instruments is
estimated as the net present value of expected future cash
flows based on external inputs.
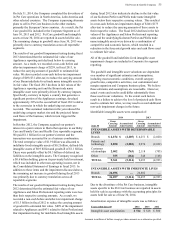
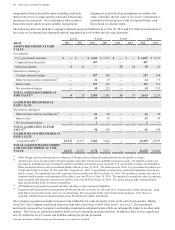
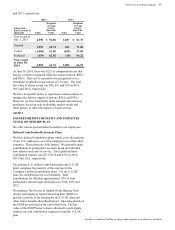
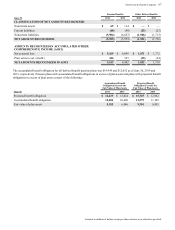
The following table sets forth the Company's financial assets and liabilities as of June 30, 2014 and 2013 that were measured at
fair value on a recurring basis during the period, segregated by level within the fair value hierarchy:
Level 1 Level 2 Level 3 Total
June 30 2014 2013 2014 2013 2014 2013 2014 2013
ASSETS RECORDED AT FAIR
VALUE
Investments:
U.S. government securities $—
$—
$ 1,631 $ 1,571 $—
$—
$ 1,631 $ 1,571
Corporate bond securities ——497 ———497 —
Other investments 623 ——24 24 30 47
Derivatives relating to:
Foreign currency hedges ——187 168 ——187 168
Other foreign currency instruments(1) ——24 19 ——24 19
Interest rates ——197 191 ——197 191
Net investment hedges ——49 233 ——49 233
TOTAL ASSETS RECORDED AT
FAIR VALUE(2) 623 2,585 2,182 24 24 2,615 2,229
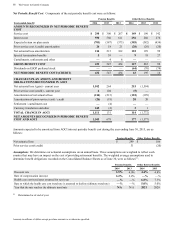
LIABILITIES RECORDED AT
FAIR VALUE
Derivatives relating to:
Other foreign currency instruments(1) ——66 90 ——66 90
Interest rates ——29 59 ——29 59
Net investment hedges ——1———1—
TOTAL LIABILITIES AT FAIR
VALUE(3) ——96 149 ——96 149
LIABILITIES NOT RECORDED AT
FAIR VALUE
Long-term debt (4) 24,747 22,671 1,682 3,022 ——26,429 25,693
TOTAL LIABILITIES RECORDED
AND NOT RECORDED AT FAIR
VALUE 24,747 22,671 1,778 3,171 ——26,525 25,842
(1) Other foreign currency instruments are comprised of foreign currency financial instruments that do not qualify as hedges.
(2) All derivative assets are presented in Prepaid expenses and other current assets and Other noncurrent assets. Investment securities are
presented in Available-for-sale investment securities and Other noncurrent assets, except the U.S. government securities are included in
Other noncurrent assets in our Consolidated Balance Sheets at June 30, 2013. The amortized cost of the U.S. government securities was
$1,649 and $1,604 as of June 30, 2014 and 2013, respectively. All U.S. government securities have contractual maturities between one
and five years. The amortized cost of the corporate bond securities was $497 as of June 30, 2014. The amortized cost and fair value of
corporate bond securities with maturities of less than a year was $39 as of June 30, 2014. The amortized cost and fair value of corporate
bond securities with maturities between one and five years was $458 as of June 30, 2014. Fair values are generally estimated based
upon quoted market prices for similar instruments.
(3) All liabilities are presented in accrued and other liabilities or other noncurrent liabilities.
(4) Long-term debt includes the current portion ($4,400 and $4,540 as of June 30, 2014 and 2013, respectively) of debt instruments. Long-
term debt is not recorded at fair value on a recurring basis, but is measured at fair value for disclosure purposes. Fair values are
generally estimated based on quoted market prices for identical or similar instruments.
The Company recognizes transfers between levels within the fair value hierarchy, if any, at the end of each quarter. During
fiscal 2013, the Company transferred long-term debt with a fair value of $455 from Level 1 to Level 2. The transferred
instruments represent the Company's outstanding industrial development bonds which are infrequently traded in an observable
market. There were no additional transfers between levels during the periods presented. In addition, there was no significant
activity within the Level 3 assets and liabilities during the periods presented.