Proctor and Gamble 2014 Annual Report Download - page 28
Download and view the complete annual report
Please find page 28 of the 2014 Proctor and Gamble annual report below. You can navigate through the pages in the report by either clicking on the pages listed below, or by using the keyword search tool below to find specific information within the annual report.-
 1
1 -
2
-
3
-
4
-
5
-
6
-
7
-
8
-
9
-
10
-
11
-
12
-
13
-
14
-
15
-
16
-
17
-
 18
18 -
 19
19 -
 20
20 -
 21
21 -
 22
22 -
 23
23 -
 24
24 -
 25
25 -
 26
26 -
 27
27 -
 28
28 -
 29
29 -
 30
30 -
 31
31 -
 32
32 -
 33
33 -
 34
34 -
 35
35 -
 36
36 -
 37
37 -
 38
38 -
39
-
40
-
41
-
42
-
43
-
44
-
45
-
46
-
47
-
48
-
49
-
50
-
51
-
52
-
53
-
54
-
55
-
56
-
57
-
58
-
59
-
60
-
61
-
62
-
63
-
64
-
65
-
66
-
67
-
68
-
69
-
70
-
71
-
72
-
73
-
74
-
75
-
76
-
77
-
78
-
79
-
80
-
81
-
82
-
83
-
84
-
85
-
86
-
87
-
88
-
89
-
90
-
91
-
92
-
93
-
94
 |
 |
26 The Procter & Gamble Company
Cost Pressures. Our costs are subject to fluctuations,
particularly due to changes in commodity prices, raw
materials, labor costs, foreign exchange and interest rates.
Therefore, our success is dependent, in part, on our
continued ability to manage these fluctuations through
pricing actions, cost savings projects, sourcing decisions and
certain hedging transactions, as well as ongoing productivity
improvements. We also must manage our debt and currency
exposure, especially in certain countries with currency
exchange controls, such as Venezuela, China, India, Egypt
and Argentina. We need to maintain key manufacturing and
supply arrangements, including sole supplier and
manufacturing plant arrangements, and successfully manage
any disruptions at Company manufacturing sites. We must
implement, achieve and sustain cost improvement plans,
including our established outsourcing relationships and those
related to general overhead and workforce optimization.
Successfully managing these changes, including identifying,
developing and retaining key employees, is critical to our
success.
Global Economic Conditions. Demand for our products has
a correlation to global macroeconomic factors. The current
macroeconomic factors remain dynamic. Economic
changes, terrorist activity, political unrest and natural
disasters may result in business interruption, inflation,
deflation or decreased demand for our products. Our
success will depend, in part, on our ability to manage
continued global political and/or economic uncertainty,
especially in our significant geographic markets, due to
terrorist and other hostile activities or natural disasters. We
could also be negatively impacted by a global, regional or
national economic crisis, including sovereign risk in the
event of a deterioration in the credit worthiness of, or a
default by local governments, resulting in a disruption of
credit markets. Such events could negatively impact our
ability to collect receipts due from governments, including
refunds of value added taxes, create significant credit risks
relative to our local customers and depository institutions
and/or negatively impact our overall liquidity. Additionally,
changes in exchange controls and other limits could impact
our ability to repatriate earnings from overseas.
Regulatory Environment. Changes in laws, regulations and
the related interpretations may alter the environment in
which we do business. This includes changes in
environmental, competitive and product-related laws, as well
as changes in accounting standards and tax laws or the
enforcement thereof. Our ability to manage regulatory, tax
and legal matters (including, but not limited to, product
liability, patent and other intellectual property matters) and
to resolve pending legal matters within current estimates
may impact our results.
RESULTS OF OPERATIONS
The key metrics included in our discussion of our
consolidated results of operations include net sales, gross
margin, selling, general and administrative expenses
(SG&A), other non-operating items and income taxes. The
primary factors driving year-over-year changes in net sales
include overall market growth in the categories in which we
compete, product initiatives, the level of initiatives and other
activities by competitors, geographic expansion and
acquisition and divestiture activity, all of which drive
changes in our underlying unit volume, as well as pricing
actions (which can also indirectly impact volume), changes
in product and geographic mix and foreign currency impacts
on sales outside the U.S.
Most of our cost of products sold and SG&A are to some
extent variable in nature. Accordingly, our discussion of
these operating costs focuses primarily on relative margins
rather than the absolute year-over-year changes in total
costs. The primary drivers of changes in gross margin are
input costs (energy and other commodities), pricing impacts,
geographic mix (for example, gross margins in developed
markets are generally higher than in developing markets for
similar products), product mix (for example, the Beauty
segment has higher gross margins than the Company
average), foreign exchange rate fluctuations (in situations
where certain input costs may be tied to a different
functional currency than the underlying sales), the impacts
of manufacturing savings projects and to a lesser extent scale
impacts (for costs that are fixed or less variable in nature).
The primary drivers of SG&A are marketing-related costs
and overhead costs. Marketing-related costs are primarily
variable in nature, although we do achieve some level of
scale benefit over time due to overall growth and other
marketing efficiencies. Overhead costs are also variable in
nature, but on a relative basis, less so than marketing costs
due to our ability to leverage our organization and systems
infrastructures to support business growth. Accordingly, we
generally experience more scale-related impacts for these
costs.
The Company is in the midst of a productivity and cost
savings plan to reduce costs in the areas of supply chain,
research and development, marketing and overhead
expenses. The plan is designed to accelerate cost reductions
by streamlining management decision making,
manufacturing and other work processes to fund the
Company's growth strategy. The Company expects to incur
in excess of $4.5 billion in before-tax restructuring costs
over a five-year period (fiscal 2012 through fiscal 2016) as
part of this plan. Overall, the costs and other non-
manufacturing enrollment reductions are expected to deliver
in excess of $2.8 billion in annual gross before-tax savings
(see Note 3 to our Consolidated Financial Statements).
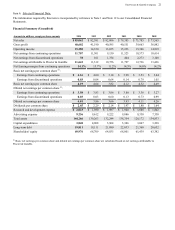
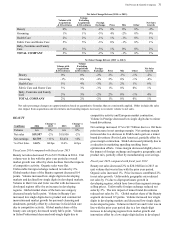
Net Sales
Fiscal year 2014 compared with fiscal year 2013
Net sales increased 1% to $83.1 billion in 2014 on a 3%
increase in unit volume versus the prior year period. Fabric
Care and Home Care along with Baby, Feminine and Family
Care volume grew mid-single digits. Grooming and Health
Care volume grew low single digits. Beauty volume was
unchanged. Volume increased low single digits in developed
regions and grew mid-single digits in developing regions.