Proctor and Gamble 2014 Annual Report Download - page 65
Download and view the complete annual report
Please find page 65 of the 2014 Proctor and Gamble annual report below. You can navigate through the pages in the report by either clicking on the pages listed below, or by using the keyword search tool below to find specific information within the annual report.-
 1
1 -
2
-
3
-
4
-
5
-
6
-
7
-
8
-
9
-
10
-
11
-
12
-
13
-
14
-
15
-
16
-
17
-
18
-
19
-
20
-
21
-
22
-
23
-
24
-
25
-
26
-
27
-
28
-
29
-
30
-
31
-
32
-
33
-
34
-
35
-
36
-
37
-
38
-
39
-
40
-
41
-
42
-
43
-
44
-
45
-
46
-
47
-
48
-
49
-
50
-
51
-
52
-
53
-
54
-
 55
55 -
 56
56 -
 57
57 -
 58
58 -
 59
59 -
 60
60 -
 61
61 -
 62
62 -
 63
63 -
 64
64 -
 65
65 -
 66
66 -
 67
67 -
 68
68 -
 69
69 -
 70
70 -
 71
71 -
 72
72 -
 73
73 -
 74
74 -
 75
75 -
76
-
77
-
78
-
79
-
80
-
81
-
82
-
83
-
84
-
85
-
86
-
87
-
88
-
89
-
90
-
91
-
92
-
93
-
94
 |
 |

The Procter & Gamble Company 63
Amounts in millions of dollars except per share amounts or as otherwise specified.
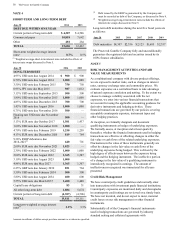
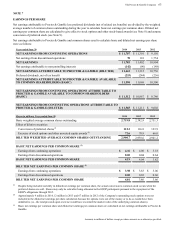
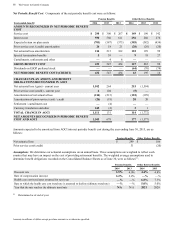
NOTE 7
EARNINGS PER SHARE
Net earnings attributable to Procter & Gamble less preferred dividends (net of related tax benefits) are divided by the weighted
average number of common shares outstanding during the year to calculate basic net earnings per common share. Diluted net
earnings per common share are calculated to give effect to stock options and other stock-based awards (see Note 8) and assume
conversion of preferred stock (see Note 9).
Net earnings attributable to Procter & Gamble and common shares used to calculate basic and diluted net earnings per share
were as follows:
Years ended June 30 2014 2013 2012
NET EARNINGS FROM CONTINUING OPERATIONS $ 11,707 $ 11,301 $ 9,150
Net earnings from discontinued operations 78 101 1,754
NET EARNINGS 11,785 11,402 10,904
Net earnings attributable to noncontrolling interests (142)(90)(148)
NET EARNINGS ATTRIBUTABLE TO PROCTER & GAMBLE (DILUTED) 11,643 11,312 10,756
Preferred dividends, net of tax benefit (253)(244)(256)
NET EARNINGS ATTRIBUTABLE TO PROCTER & GAMBLE AVAILABLE
TO COMMON SHAREHOLDERS (BASIC) 11,390 11,068 10,500
NET EARNINGS FROM CONTINUING OPERATIONS ATTRIBUTABLE TO
PROCTER & GAMBLE AVAILABLE TO COMMON SHAREHOLDERS
(BASIC) $ 11,312 $ 10,967 $ 8,746
NET EARNINGS FROM CONTINUTING OPERATIONS ATTRIBUTABLE TO
PROCTER & GAMBLE (DILUTED) $ 11,565 $ 11,211 $ 9,002
Shares in millions; Years ended June 30 2014 2013 2012
Basic weighted average common shares outstanding 2,719.8 2,742.9 2,751.3
Effect of dilutive securities
Conversion of preferred shares(1) 112.3 116.8 123.9
Exercise of stock options and other unvested equity awards (2) 72.6 70.9 66.0
DILUTED WEIGHTED AVERAGE COMMON SHARES OUTSTANDING 2,904.7 2,930.6 2,941.2
BASIC NET EARNINGS PER COMMON SHARE (3)
Earnings from continuing operations $ 4.16 $ 4.00 $ 3.18
Earnings from discontinued operations 0.03 0.04 0.64
BASIC NET EARNINGS PER COMMON SHARE 4.19 4.04 3.82
DILUTED NET EARNINGS PER COMMON SHARE (3)
Earnings from continuing operations $ 3.98 $ 3.83 $ 3.06
Earnings from discontinued operations 0.03 0.03 0.60
DILUTED NET EARNINGS PER COMMON SHARE 4.01 3.86 3.66
(1) Despite being included currently in diluted net earnings per common share, the actual conversion to common stock occurs when the
preferred shares are sold. Shares may only be sold after being allocated to the ESOP participants pursuant to the repayment of the
ESOP's obligations through 2035.
(2) Approximately 9 million in 2014, 12 million in 2013 and 67 million in 2012 of the Company's outstanding stock options were not
included in the diluted net earnings per share calculation because the options were out of the money or to do so would have been
antidilutive (i.e., the total proceeds upon exercise would have exceeded the market value of the underlying common shares).
(3) Basic net earnings per common share and diluted net earnings per common share are calculated on net earnings attributable to Procter &
Gamble.