Proctor and Gamble 2014 Annual Report Download - page 60
Download and view the complete annual report
Please find page 60 of the 2014 Proctor and Gamble annual report below. You can navigate through the pages in the report by either clicking on the pages listed below, or by using the keyword search tool below to find specific information within the annual report.-
 1
1 -
2
-
3
-
4
-
5
-
6
-
7
-
8
-
9
-
10
-
11
-
12
-
13
-
14
-
15
-
16
-
17
-
18
-
19
-
20
-
21
-
22
-
23
-
24
-
25
-
26
-
27
-
28
-
29
-
30
-
31
-
32
-
33
-
34
-
35
-
36
-
37
-
38
-
39
-
40
-
41
-
42
-
43
-
44
-
45
-
46
-
47
-
48
-
49
-
 50
50 -
 51
51 -
 52
52 -
 53
53 -
 54
54 -
 55
55 -
 56
56 -
 57
57 -
 58
58 -
 59
59 -
 60
60 -
 61
61 -
 62
62 -
 63
63 -
 64
64 -
 65
65 -
 66
66 -
 67
67 -
 68
68 -
 69
69 -
 70
70 -
71
-
72
-
73
-
74
-
75
-
76
-
77
-
78
-
79
-
80
-
81
-
82
-
83
-
84
-
85
-
86
-
87
-
88
-
89
-
90
-
91
-
92
-
93
-
94
 |
 |

58 The Procter & Gamble Company
Amounts in millions of dollars except per share amounts or as otherwise specified.
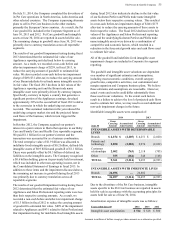
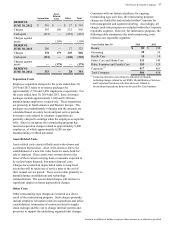
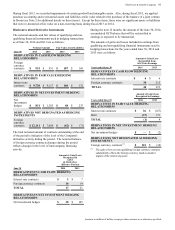
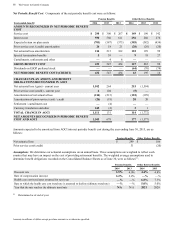
NOTE 4
SHORT-TERM AND LONG-TERM DEBT
June 30 2014 2013
DEBT DUE WITHIN ONE YEAR
Current portion of long-term debt $ 4,307 $ 4,506
Commercial paper 10,818 7,642
Other 481 284
TOTAL 15,606 12,432
Short-term weighted average interest
rates(1) 0.7% 0.5%
(1) Weighted average short-term interest rates include the effects of
interest rate swaps discussed in Note 5.
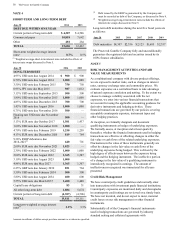
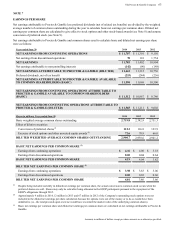
June 30 2014 2013
LONG-TERM DEBT
4.95% USD note due August 2014 $ 900 $ 900
0.70% USD note due August 2014 1,000 1,000
3.50% USD note due February 2015 750 750
0.95% JPY note due May 2015 987 1,012
3.15% USD note due September 2015 500 500
1.80% USD note due November 2015 1,000 1,000
4.85% USD note due December 2015 700 700
1.45% USD note due August 2016 1,000 1,000
0.75% USD note due November 2016 500 —
Floating rate USD note due November
2016 500 —
5.13% EUR note due October 2017 1,501 1,437
1.60% USD note due November 2018 1,000 —
4.70% USD note due February 2019 1,250 1,250
4.13% EUR note due December 2020 819 784
9.36% ESOP debentures due
2014-2021(1) 640 701
2.00% EUR note due November 2021 1,023 —
2.30% USD note due February 2022 1,000 1,000
2.00% EUR note due August 2022 1,365 1,307
3.10% USD note due August 2023 1,000 —
4.88% EUR note due May 2027 1,365 1,307
6.25% GBP note due January 2030 851 764
5.50% USD note due February 2034 500 500
5.80% USD note due August 2034 600 600
5.55% USD note due March 2037 1,400 1,400
Capital lease obligations 83 31
All other long-term debt 1,884 5,674
Current portion of long-term debt (4,307) (4,506)
TOTAL 19,811 19,111
Long-term weighted average interest
rates(2) 3.2% 3.3%
(1) Debt issued by the ESOP is guaranteed by the Company and
must be recorded as debt of the Company, as discussed in Note 9.
(2) Weighted average long-term interest rates include the effects of
interest rate swaps discussed in Note 5.
Long-term debt maturities during the next five fiscal years are
as follows:
June 30 2015 2016 2017 2018 2019
Debt maturities $4,307 $2,356 $2,123 $1,605 $ 2,357
The Procter & Gamble Company fully and unconditionally
guarantees the registered debt and securities issued by its
100% finance subsidiaries.
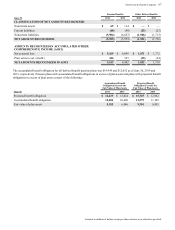
NOTE 5
RISK MANAGEMENT ACTIVITIES AND FAIR
VALUE MEASUREMENTS
As a multinational company with diverse product offerings,
we are exposed to market risks, such as changes in interest
rates, currency exchange rates and commodity prices. We
evaluate exposures on a centralized basis to take advantage
of natural exposure correlation and netting. To the extent we
choose to manage volatility associated with the net
exposures, we enter into various financial transactions that
we account for using the applicable accounting guidance for
derivative instruments and hedging activities. These
financial transactions are governed by our policies covering
acceptable counterparty exposure, instrument types and
other hedging practices.
At inception, we formally designate and document
qualifying instruments as hedges of underlying exposures.
We formally assess, at inception and at least quarterly
thereafter, whether the financial instruments used in hedging
transactions are effective at offsetting changes in either the
fair value or cash flows of the related underlying exposures.
Fluctuations in the value of these instruments generally are
offset by changes in the fair value or cash flows of the
underlying exposures being hedged. This is driven by the
high degree of effectiveness between the exposure being
hedged and the hedging instrument. The ineffective portion
of a change in the fair value of a qualifying instrument is
immediately recognized in earnings. The amount of
ineffectiveness recognized was immaterial for all years
presented.
Credit Risk Management
We have counterparty credit guidelines and normally enter
into transactions with investment grade financial institutions.
Counterparty exposures are monitored daily and downgrades
in counterparty credit ratings are reviewed on a timely basis.
We have not incurred, and do not expect to incur, material
credit losses on our risk management or other financial
instruments.
Substantially all of the Company's financial instruments
used in hedging transactions are governed by industry
standard netting and collateral agreements with