Proctor and Gamble 2014 Annual Report Download - page 38
Download and view the complete annual report
Please find page 38 of the 2014 Proctor and Gamble annual report below. You can navigate through the pages in the report by either clicking on the pages listed below, or by using the keyword search tool below to find specific information within the annual report.-
 1
1 -
2
-
3
-
4
-
5
-
6
-
7
-
8
-
9
-
10
-
11
-
12
-
13
-
14
-
15
-
16
-
17
-
18
-
19
-
20
-
21
-
22
-
23
-
24
-
25
-
26
-
27
-
 28
28 -
 29
29 -
 30
30 -
 31
31 -
 32
32 -
 33
33 -
 34
34 -
 35
35 -
 36
36 -
 37
37 -
 38
38 -
 39
39 -
 40
40 -
 41
41 -
 42
42 -
 43
43 -
 44
44 -
 45
45 -
 46
46 -
 47
47 -
 48
48 -
49
-
50
-
51
-
52
-
53
-
54
-
55
-
56
-
57
-
58
-
59
-
60
-
61
-
62
-
63
-
64
-
65
-
66
-
67
-
68
-
69
-
70
-
71
-
72
-
73
-
74
-
75
-
76
-
77
-
78
-
79
-
80
-
81
-
82
-
83
-
84
-
85
-
86
-
87
-
88
-
89
-
90
-
91
-
92
-
93
-
94
 |
 |
36 The Procter & Gamble Company
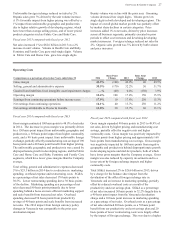
Fiscal year 2013 compared with fiscal year 2012
Operating cash flow was $14.9 billion in 2013, a 12%
increase from the prior year. Operating cash flows resulted
primarily from net earnings, adjusted for non-cash items
(depreciation and amortization, stock-based compensation,
asset impairments, deferred income taxes and gains on sale
and purchase of businesses) and a decrease in working
capital. Increased accounts receivable used $415 million of
cash primarily to fund growth. In addition, accounts
receivable days sales outstanding increased two days due to
the timing and mix of sales late in the period and foreign
exchange impacts. Increased inventory used $225 million of
cash to support product initiatives and to build stock to
support capacity expansions and manufacturing sourcing
changes, partially offset by inventory management
improvement efforts. Inventory days on hand increased by
one day primarily due to foreign exchange impacts.
Increased accounts payable, accrued and other liabilities
generated $1.3 billion of cash primarily due to an increase in
marketing accruals from increased advertising and other
marketing costs.
Free Cash Flow. We view free cash flow as an important
measure because it is a factor impacting the amount of cash
available for dividends, share repurchases, acquisitions and
other discretionary investment. It is defined as operating
cash flow less capital expenditures and is one of the
measures used to evaluate senior management and determine
their at-risk compensation.
Fiscal year 2014 compared with fiscal year 2013
Free cash flow was $10.1 billion in 2014, a decrease of 7%
versus the prior year. The decrease was driven by the
decrease in operating cash flows, which was primarily due to
a $1 billion discretionary contribution into a foreign pension
plan. Free cash flow productivity, defined as the ratio of free
cash flow to net earnings, was 86% in 2014.
Fiscal year 2013 compared with fiscal year 2012
Free cash flow was $10.9 billion in 2013, an increase of 17%
versus the prior year. The increase was driven by the
increase in operating cash flows. Free cash flow
productivity, defined as the ratio of free cash flow to net
earnings, was 95% in 2013.
Investing Cash Flows
Fiscal year 2014 compared with fiscal year 2013
Net investing activities consumed $4.1 billion in cash in
2014 mainly due to capital spending and cash paid for
investments in available-for-sale securities, partially offset
by asset sales.
Fiscal year 2013 compared with fiscal year 2012
Net investing activities consumed $6.3 billion in cash in
2013 mainly due to capital spending, cash paid for
acquisitions and investments in available-for-sale securities,
partially offset by asset sales.
Capital Spending. We manage capital spending to support
our business growth plans and have cost controls to deliver
our cash generation targets. Capital expenditures, primarily
to support capacity expansion, innovation and cost savings,
were $3.8 billion in 2014 and $4.0 billion in 2013. Capital
spending as a percentage of net sales decreased 30 basis
points to 4.6% in 2014. Capital spending as a percentage of
net sales in 2013 increased 10 basis points to 4.9%.
Acquisitions. Acquisition activity was not material in 2014.
Acquisitions used $1.1 billion of cash in 2013 primarily for
the acquisition of our partner's interest in a joint venture in
Iberia.
Proceeds from Divestitures and Other Asset Sales.
Proceeds from asset sales contributed $570 million in cash in
2014 mainly due to minor brand divestiture activities,
including MDVIP, the Pert business in Latin America, and
the bleach business in CEEMEA and Latin America.
Proceeds from asset sales contributed $584 million in cash in
2013 mainly due to the divestitures of the bleach business in
Italy and the Braun household appliances business.
Financing Cash Flows
Dividend Payments. Our first discretionary use of cash is
dividend payments. Dividends per common share increased
7% to $2.45 per share in 2014. Total dividend payments to
common and preferred shareholders were $6.9 billion in
2014 and $6.5 billion in 2013. In April 2014, the Board of
Directors declared an increase in our quarterly dividend
from $0.6015 to $0.6436 per share on Common Stock and
Series A and B ESOP Convertible Class A Preferred Stock.
This represents a 7% increase compared to the prior
quarterly dividend and is the 58th consecutive year that our
dividend has increased. We have paid a dividend in every
year since our incorporation in 1890.
Long-Term and Short-Term Debt. We maintain debt levels
we consider appropriate after evaluating a number of factors,
including cash flow expectations, cash requirements for
ongoing operations, investment and financing plans
(including acquisitions and share repurchase activities) and
the overall cost of capital. Total debt was $35.4 billion as of
June 30, 2014 and $31.5 billion as of June 30, 2013. Our
total debt increased in 2014 mainly due to debt issuances
and an increase in commercial paper outstanding, partially
offset by bond maturities.
Treasury Purchases. Total share repurchases were $6.0
billion in 2014 and 2013.
Liquidity
At June 30, 2014, our current liabilities exceeded current
assets by $2.1 billion ($4.3 billion, excluding current assets
and current liabilities of the Pet Care business held for sale),
largely due to short-term borrowings under our commercial
paper program. We anticipate being able to support our
short-term liquidity and operating needs largely through cash
generated from operations. The Company regularly assesses