Proctor and Gamble 2014 Annual Report Download - page 73
Download and view the complete annual report
Please find page 73 of the 2014 Proctor and Gamble annual report below. You can navigate through the pages in the report by either clicking on the pages listed below, or by using the keyword search tool below to find specific information within the annual report.-
 1
1 -
2
-
3
-
4
-
5
-
6
-
7
-
8
-
9
-
10
-
11
-
12
-
13
-
14
-
15
-
16
-
17
-
18
-
19
-
20
-
21
-
22
-
23
-
24
-
25
-
26
-
27
-
28
-
29
-
30
-
31
-
32
-
33
-
34
-
35
-
36
-
37
-
38
-
39
-
40
-
41
-
42
-
43
-
44
-
45
-
46
-
47
-
48
-
49
-
50
-
51
-
52
-
53
-
54
-
55
-
56
-
57
-
58
-
59
-
60
-
61
-
62
-
 63
63 -
 64
64 -
 65
65 -
 66
66 -
 67
67 -
 68
68 -
 69
69 -
 70
70 -
 71
71 -
 72
72 -
 73
73 -
 74
74 -
 75
75 -
 76
76 -
 77
77 -
 78
78 -
 79
79 -
 80
80 -
 81
81 -
 82
82 -
 83
83 -
84
-
85
-
86
-
87
-
88
-
89
-
90
-
91
-
92
-
93
-
94
 |
 |

The Procter & Gamble Company 71
Amounts in millions of dollars except per share amounts or as otherwise specified.
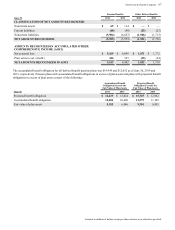
Class A Preferred Stock to fund a portion of retiree health
care benefits. These shares, net of the ESOP's debt, are
considered plan assets of the other retiree benefits plan
discussed above. Debt service requirements are funded by
preferred stock dividends, cash contributions and advances
provided by the Company, of which $602 is outstanding at
June 30, 2014. Each share is convertible at the option of the
holder into one share of the Company's common stock. The
dividend for the current year was equal to the common stock
dividend of $2.45 per share. The liquidation value is $12.96
per share.
Our ESOP accounting practices are consistent with current
ESOP accounting guidance, including the permissible
continuation of certain provisions from prior accounting
guidance. ESOP debt, which is guaranteed by the Company,
is recorded as debt (see Note 4) with an offset to the reserve
for ESOP debt retirement, which is presented within
shareholders' equity. Advances to the ESOP by the
Company are recorded as an increase in the reserve for
ESOP debt retirement. Interest incurred on the ESOP debt is
recorded as interest expense. Dividends on all preferred
shares, net of related tax benefits, are charged to retained
earnings.
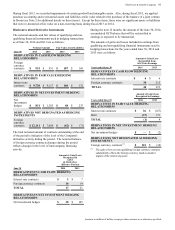
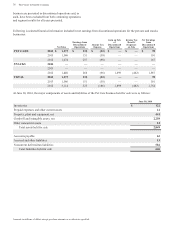
The series A and B preferred shares of the ESOP are
allocated to employees based on debt service requirements,
net of advances made by the Company to the Trust. The
number of preferred shares outstanding at June 30 was as
follows:
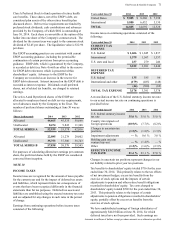
Shares in thousands 2014 2013 2012
Allocated 44,465 45,535 50,668
Unallocated 8,474 9,843 11,348
TOTAL SERIES A 52,939 55,378 62,016
Allocated 22,085 21,278 20,802
Unallocated 35,753 37,300 38,743
TOTAL SERIES B 57,838 58,578 59,545
For purposes of calculating diluted net earnings per common
share, the preferred shares held by the ESOP are considered
converted from inception.
NOTE 10
INCOME TAXES
Income taxes are recognized for the amount of taxes payable
for the current year and for the impact of deferred tax assets
and liabilities, which represent future tax consequences of
events that have been recognized differently in the financial
statements than for tax purposes. Deferred tax assets and
liabilities are established using the enacted statutory tax rates
and are adjusted for any changes in such rates in the period
of change.
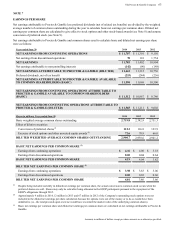
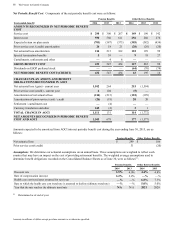
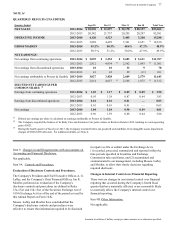
Earnings from continuing operations before income taxes
consisted of the following:
Years ended June 30 2014 2013 2012
United States $ 9,005 $ 8,260 $ 7,398
International 5,880 6,432 5,130
TOTAL 14,885 14,692 12,528
Income taxes on continuing operations consisted of the
following:
Years ended June 30 2014 2013 2012
CURRENT TAX
EXPENSE
U.S. federal $ 1,606 $ 1,845 $ 1,837
International 1,379 1,567 1,357
U.S. state and local 237 279 246
3,222 3,691 3,440
DEFERRED TAX
EXPENSE
U.S. federal 135 185 86
International and other (179) (485) (148)
(44) (300) (62)
TOTAL TAX EXPENSE 3,178 3,391 3,378
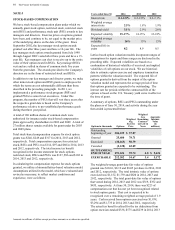
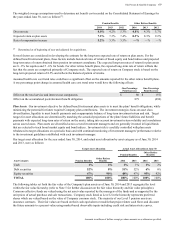
A reconciliation of the U.S. federal statutory income tax rate
to our actual income tax rate on continuing operations is
provided below:
Years ended June 30 2014 2013 2012
U.S. federal statutory income
tax rate 35.0 % 35.0 % 35.0 %
Country mix impacts of
foreign operations (10.9)% (7.7)% (8.2)%
Changes in uncertain tax
positions (1.5)% (1.8)% (1.3)%
Impairment adjustments —% 0.6 % 3.8 %
Holding gain on joint
venture buy-out —% (1.4)% — %
Other (1.2)% (1.6)% (2.3)%
EFFECTIVE INCOME
TAX RATE 21.4 % 23.1 % 27.0 %
Changes in uncertain tax positions represent changes in our
net liability related to prior year tax positions.
Tax benefits to shareholders' equity totaled $716 for the year
ended June 30, 2014. This primarily relates to the tax effects
of net investment hedges, excess tax benefits from the
exercise of stock options and the impacts of certain
adjustments to pension and other retiree benefit obligations
recorded in shareholders' equity. Tax costs charged to
shareholders' equity totaled $503 for the year ended June 30,
2013. This primarily relates to the impact of certain
adjustments to pension obligations recorded in shareholders'
equity, partially offset by excess tax benefits from the
exercise of stock options.
We have undistributed earnings of foreign subsidiaries of
approximately $44.0 billion at June 30, 2014, for which
deferred taxes have not been provided. Such earnings are