Proctor and Gamble 2014 Annual Report Download - page 23
Download and view the complete annual report
Please find page 23 of the 2014 Proctor and Gamble annual report below. You can navigate through the pages in the report by either clicking on the pages listed below, or by using the keyword search tool below to find specific information within the annual report.-
 1
1 -
2
-
3
-
4
-
5
-
6
-
7
-
8
-
9
-
10
-
11
-
12
-
 13
13 -
 14
14 -
 15
15 -
 16
16 -
 17
17 -
 18
18 -
 19
19 -
 20
20 -
 21
21 -
 22
22 -
 23
23 -
 24
24 -
 25
25 -
 26
26 -
 27
27 -
 28
28 -
 29
29 -
 30
30 -
 31
31 -
 32
32 -
 33
33 -
34
-
35
-
36
-
37
-
38
-
39
-
40
-
41
-
42
-
43
-
44
-
45
-
46
-
47
-
48
-
49
-
50
-
51
-
52
-
53
-
54
-
55
-
56
-
57
-
58
-
59
-
60
-
61
-
62
-
63
-
64
-
65
-
66
-
67
-
68
-
69
-
70
-
71
-
72
-
73
-
74
-
75
-
76
-
77
-
78
-
79
-
80
-
81
-
82
-
83
-
84
-
85
-
86
-
87
-
88
-
89
-
90
-
91
-
92
-
93
-
94
 |
 |

The Procter & Gamble Company 21
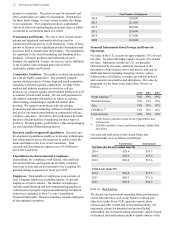
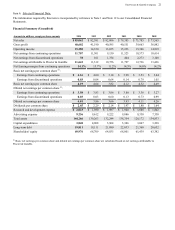
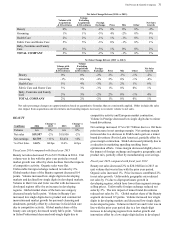
Item 6. Selected Financial Data.
The information required by this item is incorporated by reference to Note 1 and Note 12 to our Consolidated Financial
Statements.
Financial Summary (Unaudited)
Amounts in millions, except per share amounts 2014 2013 2012 2011 2010 2009
Net sales $ 83,062 $ 82,581 $ 82,006 $ 79,385 $ 75,785 $ 73,565
Gross profit 40,602 41,190 40,595 40,551 39,663 36,882
Operating income 15,288 14,330 13,035 15,233 15,306 14,819
Net earnings from continuing operations 11,707 11,301 9,150 11,523 10,573 10,414
Net earnings from discontinued operations 78 101 1,754 404 2,273 3,108
Net earnings attributable to Procter & Gamble 11,643 11,312 10,756 11,797 12,736 13,436
Net Earnings margin from continuing operations 14.1% 13.7% 11.2% 14.5% 14.0% 14.2%
Basic net earnings per common share (1):
Earnings from continuing operations $ 4.16 $ 4.00 $ 3.18 $ 3.98 $ 3.53 $ 3.44
Earnings from discontinued operations 0.03 0.04 0.64 0.14 0.79 1.05
Basic net earnings per common share 4.19 4.04 3.82 4.12 4.32 4.49
Diluted net earnings per common share (1):
Earnings from continuing operations $ 3.98 $ 3.83 $ 3.06 $ 3.80 $ 3.38 $ 3.27
Earnings from discontinued operations 0.03 0.03 0.60 0.13 0.73 0.99
Diluted net earnings per common share 4.01 3.86 3.66 3.93 4.11 4.26
Dividends per common share $ 2.45 $ 2.29 $ 2.14 $ 1.97 $ 1.80 $ 1.64
Research and development expense $ 2,023 $ 1,980 $ 1,987 $ 1,940 $ 1,888 $ 1,802
Advertising expense 9,236 9,612 9,222 9,086 8,338 7,338
Total assets 144,266 139,263 132,244 138,354 128,172 134,833
Capital expenditures 3,848 4,008 3,964 3,306 3,067 3,238
Long-term debt 19,811 19,111 21,080 22,033 21,360 20,652
Shareholders' equity 69,976 68,709 64,035 68,001 61,439 63,382
(1) Basic net earnings per common share and diluted net earnings per common share are calculated based on net earnings attributable to
Procter & Gamble.