Proctor and Gamble 2014 Annual Report Download - page 72
Download and view the complete annual report
Please find page 72 of the 2014 Proctor and Gamble annual report below. You can navigate through the pages in the report by either clicking on the pages listed below, or by using the keyword search tool below to find specific information within the annual report.-
 1
1 -
2
-
3
-
4
-
5
-
6
-
7
-
8
-
9
-
10
-
11
-
12
-
13
-
14
-
15
-
16
-
17
-
18
-
19
-
20
-
21
-
22
-
23
-
24
-
25
-
26
-
27
-
28
-
29
-
30
-
31
-
32
-
33
-
34
-
35
-
36
-
37
-
38
-
39
-
40
-
41
-
42
-
43
-
44
-
45
-
46
-
47
-
48
-
49
-
50
-
51
-
52
-
53
-
54
-
55
-
56
-
57
-
58
-
59
-
60
-
61
-
 62
62 -
 63
63 -
 64
64 -
 65
65 -
 66
66 -
 67
67 -
 68
68 -
 69
69 -
 70
70 -
 71
71 -
 72
72 -
 73
73 -
 74
74 -
 75
75 -
 76
76 -
 77
77 -
 78
78 -
 79
79 -
 80
80 -
 81
81 -
 82
82 -
83
-
84
-
85
-
86
-
87
-
88
-
89
-
90
-
91
-
92
-
93
-
94
 |
 |

70 The Procter & Gamble Company
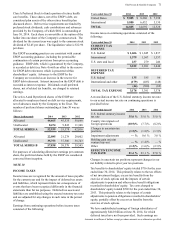
Amounts in millions of dollars except per share amounts or as otherwise specified.
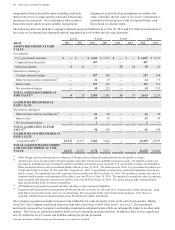
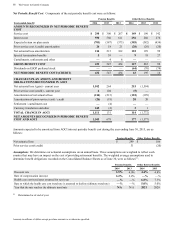
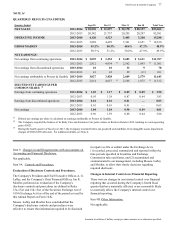
Pension Benefits
Level 1 Level 2 Level 3 Total
June 30 2014 2013 2014 2013 2014 2013 2014 2013
ASSETS AT FAIR VALUE
Cash and cash equivalents $ 79 $ 71 $—
$ — $—
$ — $ 79 $ 71
Common collective fund - equity — —
5,336 3,993 — —
5,336 3,993
Common collective fund - fixed income — —
5,539 4,361 — —
5,539 4,361
Other 5 4 — — 139 132 144 136
TOTAL ASSETS AT FAIR VALUE 84 75 10,875 8,354 139 132 11,098 8,561
Other Retiree Benefits
Level 1 Level 2 Level 3 Total
June 30 2014 2013 2014 2013 2014 2013 2014 2013
ASSETS AT FAIR VALUE
Cash and cash equivalents $ 30 $ 56 $—
$ — $—
$ — $ 30 $ 56
Company stock ——3,304 3,270 ——3,304 3,270
Common collective fund - equity — — 18 16 — — 18 16
Common collective fund - fixed income — — 217 200 — — 217 200
Other — — — — 511 5 11
TOTAL ASSETS AT FAIR VALUE 30 56 3,539 3,486 5 11 3,574 3,553
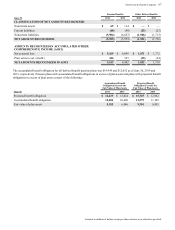
There was no significant activity within the Level 3 pension
and other retiree benefits plan assets during the years
presented.
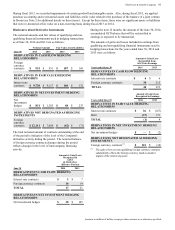
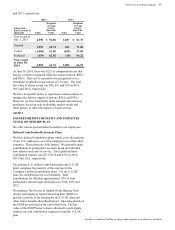
Cash Flows.Management's best estimate of cash
requirements and discretionary contributions for the defined
benefit retirement plans and other retiree benefit plans for
the year ending June 30, 2015, is $266 and $39, respectively.
For the defined benefit retirement plans, this is comprised of
$102 in expected benefit payments from the Company
directly to participants of unfunded plans and $164 of
expected contributions to funded plans. For other retiree
benefit plans, this is comprised of $25 in expected benefit
payments from the Company directly to participants of
unfunded plans and $14 of expected contributions to funded
plans. Expected contributions are dependent on many
variables, including the variability of the market value of the
plan assets as compared to the benefit obligation and other
market or regulatory conditions. In addition, we take into
consideration our business investment opportunities and
resulting cash requirements. Accordingly, actual funding
may differ significantly from current estimates.
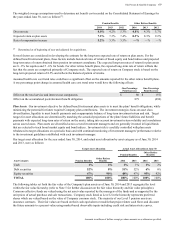
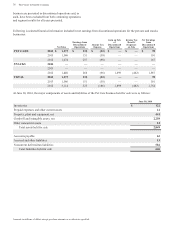
Total benefit payments expected to be paid to participants,
which include payments funded from the Company's assets,
as discussed above, as well as payments from the plans, are
as follows:
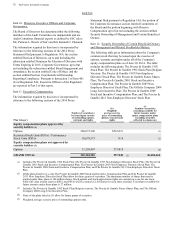
Years ending June 30
Pension
Benefits
Other Retiree
Benefits
EXPECTED BENEFIT PAYMENTS
2015 $ 584 $ 203
2016 578 218
2017 604 233
2018 614 248
2019 624 264
2020 - 2024 3,615 1,528
Employee Stock Ownership Plan
We maintain the ESOP to provide funding for certain
employee benefits discussed in the preceding paragraphs.
The ESOP borrowed $1.0 billion in 1989 and the proceeds
were used to purchase Series A ESOP Convertible Class A
Preferred Stock to fund a portion of the U.S. DC plan.
Principal and interest requirements of the borrowing were
paid by the Trust from dividends on the preferred shares and
from advances provided by the Company. The original
borrowing of $1.0 billion has been repaid in full, and
advances from the Company of $98 remain outstanding at
June 30, 2014. Each share is convertible at the option of the
holder into one share of the Company's common stock. The
dividend for the current year was equal to the common stock
dividend of $2.45 per share. The liquidation value is $6.82
per share.
In 1991, the ESOP borrowed an additional $1.0 billion. The
proceeds were used to purchase Series B ESOP Convertible