Proctor and Gamble 2014 Annual Report Download - page 76
Download and view the complete annual report
Please find page 76 of the 2014 Proctor and Gamble annual report below. You can navigate through the pages in the report by either clicking on the pages listed below, or by using the keyword search tool below to find specific information within the annual report.-
 1
1 -
2
-
3
-
4
-
5
-
6
-
7
-
8
-
9
-
10
-
11
-
12
-
13
-
14
-
15
-
16
-
17
-
18
-
19
-
20
-
21
-
22
-
23
-
24
-
25
-
26
-
27
-
28
-
29
-
30
-
31
-
32
-
33
-
34
-
35
-
36
-
37
-
38
-
39
-
40
-
41
-
42
-
43
-
44
-
45
-
46
-
47
-
48
-
49
-
50
-
51
-
52
-
53
-
54
-
55
-
56
-
57
-
58
-
59
-
60
-
61
-
62
-
63
-
64
-
65
-
 66
66 -
 67
67 -
 68
68 -
 69
69 -
 70
70 -
 71
71 -
 72
72 -
 73
73 -
 74
74 -
 75
75 -
 76
76 -
 77
77 -
 78
78 -
 79
79 -
 80
80 -
 81
81 -
 82
82 -
 83
83 -
 84
84 -
 85
85 -
 86
86 -
87
-
88
-
89
-
90
-
91
-
92
-
93
-
94
 |
 |

74 The Procter & Gamble Company
Amounts in millions of dollars except per share amounts or as otherwise specified.
•Grooming: Shave Care (Blades and Razors, Pre- and
Post-Shave Products); Appliances;
•Health Care: Personal Health Care (Gastrointestinal,
Rapid Diagnostics, Respiratory, Other Personal Health
Care, Vitamins/Minerals/Supplements); Oral Care
(Toothbrush, Toothpaste, Other Oral Care);
•Fabric Care and Home Care: Fabric Care (Laundry
Additives, Fabric Enhancers, Laundry Detergents);
Home Care (Air Care, Dish Care, Surface Care);
Personal Power (Batteries); Professional;
•Baby, Feminine and Family Care: Baby Care (Baby
Wipes, Diapers and Pants); Feminine Care (Feminine
Care, Incontinence); Family Care (Paper Towels,
Tissues, Toilet Paper).
The accounting policies of the segments are generally the
same as those described in Note 1. Differences between
these policies and U.S. GAAP primarily reflect income
taxes, which are reflected in the segments using applicable
blended statutory rates. Adjustments to arrive at our
effective tax rate are included in Corporate. Previously, we
also had a difference in the treatment of certain
unconsolidated investees. Certain unconsolidated investees
that are managed as integral parts of our businesses were
reflected as consolidated subsidiaries in management
reporting and segment results, with full recognition of the
individual income statement line items through before-tax
earnings. Eliminations to adjust these line items to U.S.
GAAP were included in Corporate. In determining after-tax
earnings for the businesses, we eliminated the share of
earnings applicable to other ownership interests, in a manner
similar to noncontrolling interest, and applied statutory tax
rates. During the final quarter of fiscal 2014, we changed our
management accounting for unconsolidated investees within
our segments, which had no impact to our consolidated
financial statements. Pursuant to this change, segment
results no longer include full recognition of the individual
income statement line items of unconsolidated investees, and
resulting eliminations of such amounts are no longer
included in corporate. All periods have been adjusted to
reflect this change.
Corporate includes certain operating and non-operating
activities that are not reflected in the operating results used
internally to measure and evaluate the businesses, as well as
items to adjust management reporting principles to U.S.
GAAP. Operating activities in Corporate include the results
of incidental businesses managed at the corporate level.
Operating elements also include certain employee benefit
costs, the costs of certain restructuring-type activities to
maintain a competitive cost structure, including
manufacturing and workforce optimization, and other
general Corporate items. The non-operating elements in
Corporate primarily include interest expense, certain
acquisition and divestiture gains and interest and investing
income.
Total assets for the reportable segments include those assets
managed by the reportable segment, primarily inventory,
fixed assets and intangible assets. Other assets, primarily
including cash, accounts receivable, investment securities
and goodwill, are included in Corporate.
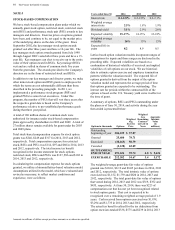
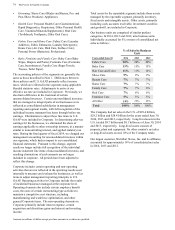
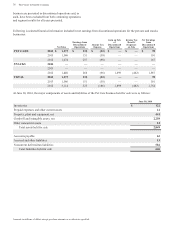
Our business units are comprised of similar product
categories. In 2014, 2013 and 2012, nine business units
individually accounted for 5% or more of consolidated net
sales as follows:
% of Sales by Business
Unit
Years ended June 30 2014 2013 2012
Fabric Care 20% 20% 20%
Baby Care 13% 13% 13%
Hair Care and Color 11% 11% 12%
Shave Care 9% 9% 9%
Beauty Care 7% 7% 7%
Home Care 7% 7% 7%
Family Care 7% 7% 6%
Oral Care 7% 6% 6%
Feminine Care 5% 5% 5%
All Other 14% 15% 15%
Total 100% 100% 100%
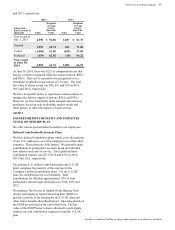
The Company had net sales in the U.S. of $29.4 billion,
$29.2 billion and $28.4 billion for the years ended June 30,
2014, 2013 and 2012, respectively. Long-lived assets in the
U.S. totaled $8.7 billion and $9.1 billion as of June 30, 2014
and 2013, respectively. Long-lived assets consists of
property, plant and equipment. No other country's net sales
or long-lived assets exceed 10% of the Company totals.
Our largest customer, Wal-Mart Stores, Inc. and its affiliates,
accounted for approximately 14% of consolidated net sales
in 2014, 2013 and 2012.