Proctor and Gamble 2016 Annual Report Download - page 2
Download and view the complete annual report
Please find page 2 of the 2016 Proctor and Gamble annual report below. You can navigate through the pages in the report by either clicking on the pages listed below, or by using the keyword search tool below to find specific information within the annual report.-
 1
1 -
 2
2 -
 3
3 -
 4
4 -
 5
5 -
 6
6 -
 7
7 -
 8
8 -
 9
9 -
 10
10 -
 11
11 -
 12
12 -
 13
13 -
14
-
15
-
16
-
17
-
18
-
19
-
20
-
21
-
22
-
23
-
24
-
25
-
26
-
27
-
28
-
29
-
30
-
31
-
32
-
33
-
34
-
35
-
36
-
37
-
38
-
39
-
40
-
41
-
42
-
43
-
44
-
45
-
46
-
47
-
48
-
49
-
50
-
51
-
52
-
53
-
54
-
55
-
56
-
57
-
58
-
59
-
60
-
61
-
62
-
63
-
64
-
65
-
66
-
67
-
68
-
69
-
70
-
71
-
72
-
73
-
74
-
75
-
76
-
77
-
78
-
79
-
80
-
81
-
82
-
83
-
84
-
85
-
86
-
87
-
88
-
89
-
90
-
91
-
92
 |
 |

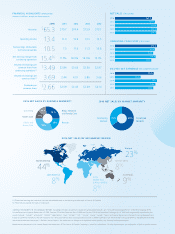
(1) Diluted net earnings per common share are calculated based on net earnings attributable to Procter & Gamble.
(2) These results exclude net sales in Corporate.
VARIOUS STATEMENTS IN THIS ANNUAL REPORT, including estimates, projections, objectives and expected results, are “forward-looking statements” within the meaning of the
Private Securities Litigation Reform Act of 1995, Section 27A of the Securities Act of 1933 and Section 21E of the Securities Exchange Act of 1934 and are generally identified by the
words “believe,” “expect,” “anticipate,” “intend,” “opportunity,” “plan,” “project,” “will,” “should,” “could,” “would,” “likely” and similar expressions. Forward-looking statements are
based on current assumptions that are subject to risks and uncertainties that may cause actual results to differ materially from the forward-looking statements, including the risks and
uncertainties discussed on pages 2–6 of this Annual Report. We undertake no obligation to update or revise publicly any forward-looking statements.
Brand names referenced in this Annual Report are trademarks of The Procter & Gamble Company or one of its subsidiaries. All other brand names are trademarks of their respective owners.
2016 NET SALES BY GEOGRAPHIC REGION
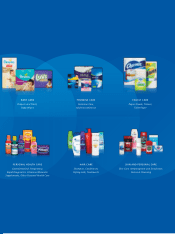
Grooming
Health Care
Fabric and
Home Care
Beauty
Baby, Feminine
and Family Care
Developed
Markets
Developing
Markets
2016 NET SALES BY BUSINESS SEGMENT(2)
FINANCIAL HIGHLIGHTS (UNAUDITED)
Amounts in billions, except per share amounts
2016 NET SALES BY MARKET MATURITY
North America
44%
Europe
23%
Greater China
8%
Asia Pacific
9%
India,
Middle East
& Africa (IMEA)
8%
Latin America
8%
2016 2015 2014 2013 2012
Net sales $65.3 $70.7 $74.4 $73.9 $73.1
Operating income 13.4 11.0 13.9 13.1 12.5
Net earnings attributable
to Procter & Gamble 10.5 7.0 11.6 11.3 10.8
Net earnings margin from
continuing operations 15.4%11.7% 14.3% 14.0% 12.1%
Diluted net earnings per
common share from
continuing operations(1)
$3.49 $2.84 $3.63 $3.50 $2.97
Diluted net earnings per
common share(1) 3.69 2.44 4.01 3.86 3.66
Dividends per
common share $2.66 $2.59 $2.45 $2.29 $2.14
65%35%
18%
28%
11%
32%
11%
NET SALES ($ BILLIONS)
2016
2015
2014
2013
2012
$74.4
$70.7
$73.9
$73.1
$65.3
OPERATING CASH FLOW ($ BILLIONS)
2016
2015
2014
2013
2012
$15.4
$14.6
$14.0
$14.9
$13.3
DILUTED NET EARNINGS (PER COMMON SHARE)
$3.692016
2015
2014
2013
2012
$2.44
$4.01
$3.86
$3.66