Proctor and Gamble 2016 Annual Report Download - page 65
Download and view the complete annual report
Please find page 65 of the 2016 Proctor and Gamble annual report below. You can navigate through the pages in the report by either clicking on the pages listed below, or by using the keyword search tool below to find specific information within the annual report.-
 1
1 -
2
-
3
-
4
-
5
-
6
-
7
-
8
-
9
-
10
-
11
-
12
-
13
-
14
-
15
-
16
-
17
-
18
-
19
-
20
-
21
-
22
-
23
-
24
-
25
-
26
-
27
-
28
-
29
-
30
-
31
-
32
-
33
-
34
-
35
-
36
-
37
-
38
-
39
-
40
-
41
-
42
-
43
-
44
-
45
-
46
-
47
-
48
-
49
-
50
-
51
-
52
-
53
-
54
-
 55
55 -
 56
56 -
 57
57 -
 58
58 -
 59
59 -
 60
60 -
 61
61 -
 62
62 -
 63
63 -
 64
64 -
 65
65 -
 66
66 -
 67
67 -
 68
68 -
 69
69 -
 70
70 -
 71
71 -
 72
72 -
 73
73 -
 74
74 -
 75
75 -
76
-
77
-
78
-
79
-
80
-
81
-
82
-
83
-
84
-
85
-
86
-
87
-
88
-
89
-
90
-
91
-
92
 |
 |

The Procter & Gamble Company 51
Amounts in millions of dollars except per share amounts or as otherwise specified.
The underfunding of pension benefits is primarily a function of the different funding incentives that exist outside of the U.S. In
certain countries, there are no legal requirements or financial incentives provided to companies to pre-fund pension obligations
prior to their due date. In these instances, benefit payments are typically paid directly from the Company's cash as they become
due.
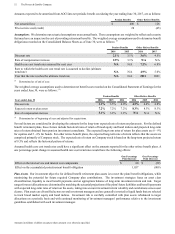
Pension Benefits Other Retiree Benefits
Years ended June 30 2016 2015 2016 2015
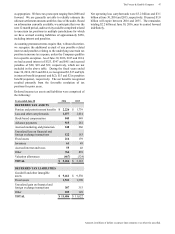
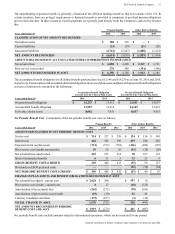
CLASSIFICATION OF NET AMOUNT RECOGNIZED
Noncurrent assets $ 180 $ 276 $—
$—
Current liabilities (33)(39)(21)(20)
Noncurrent liabilities (6,761)(5,247)(1,808)(1,414)
NET AMOUNT RECOGNIZED $ (6,614)$(5,010)$(1,829)$(1,434)
AMOUNTS RECOGNIZED IN ACCUMULATED OTHER COMPREHENSIVE INCOME (AOCI)
Net actuarial loss $6,088
$4,488$2,247
$1,731
Prior service cost/(credit) 270 300 (334)(346)
NET AMOUNTS RECOGNIZED IN AOCI $ 6,358 $4,788$1,913
$1,385
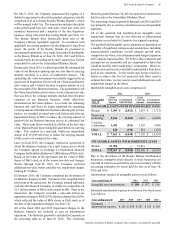
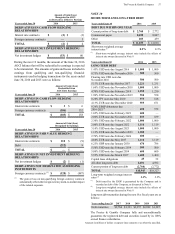
The accumulated benefit obligation for all defined benefit pension plans was $15,546 and $14,239 as of June 30, 2016 and 2015,
respectively. Pension plans with accumulated benefit obligations in excess of plan assets and plans with projected benefit obligations
in excess of plan assets consisted of the following:
Accumulated Benefit Obligation
Exceeds the Fair Value of Plan Assets
Projected Benefit Obligation
Exceeds the Fair Value of Plan Assets
Years ended June 30 2016 2015 2016 2015
Projected benefit obligation $15,233
$13,411
$15,853
$14,057
Accumulated benefit obligation 13,587 11,918 14,149 12,419
Fair value of plan assets 8,082 7,931 8,657 8,435
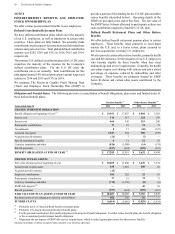
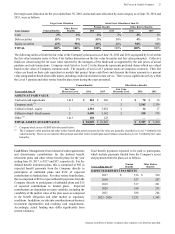
Net Periodic Benefit Cost. Components of the net periodic benefit cost were as follows:
Pension Benefits Other Retiree Benefits
Years ended June 30 2016 2015 2014 2016 2015 2014
AMOUNTS RECOGNIZED IN NET PERIODIC BENEFIT COST
Service cost $ 314 $ 317 $ 298 $ 124 $ 156 $ 149
Interest cost 466 545 590 219 240 256
Expected return on plan assets (731)(732)(701)(416)(406)(385)
Prior service cost/(credit) amortization 29 30 26 (52)(20)(20)
Net actuarial loss amortization 265 275 214 78 105 118
Special termination benefits 611 5 12 23 9
GROSS BENEFIT COST/(CREDIT) 349 446 432 (35)98 127
Dividends on ESOP preferred stock ———(52)(58)(64)
NET PERIODIC BENEFIT COST/(CREDIT) $ 349 $ 446 $ 432 $(87)$ 40 $ 63
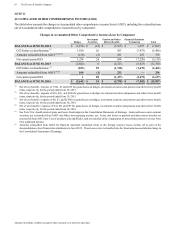
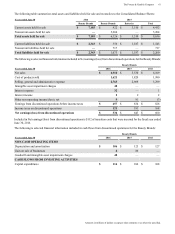
CHANGE IN PLAN ASSETS AND BENEFIT OBLIGATIONS RECOGNIZED IN AOCI
Net actuarial loss/(gain) - current year $2,028 $ 240 $ 597 $(3)
Prior service cost/(credit) - current year 817 (40)(325)
Amortization of net actuarial loss (265)(275)(78)(105)
Amortization of prior service (cost)/credit (29)(30)52 20
Currency translation and other (172)(677)(3)(34)
TOTAL CHANGE IN AOCI 1,570 (725)528 (447)
NET AMOUNTS RECOGNIZED IN PERIODIC
BENEFIT COST AND AOCI
$1,919 $(279)$ 441 $(407)
Net periodic benefit costs include amounts related to discontinued operations, which are not material for any period.