Proctor and Gamble 2016 Annual Report Download - page 23
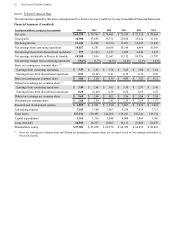
Download and view the complete annual report
Please find page 23 of the 2016 Proctor and Gamble annual report below. You can navigate through the pages in the report by either clicking on the pages listed below, or by using the keyword search tool below to find specific information within the annual report.-
 1
1 -
2
-
3
-
4
-
5
-
6
-
7
-
8
-
9
-
10
-
11
-
12
-
 13
13 -
 14
14 -
 15
15 -
 16
16 -
 17
17 -
 18
18 -
 19
19 -
 20
20 -
 21
21 -
 22
22 -
 23
23 -
 24
24 -
 25
25 -
 26
26 -
 27
27 -
 28
28 -
 29
29 -
 30
30 -
 31
31 -
 32
32 -
 33
33 -
34
-
35
-
36
-
37
-
38
-
39
-
40
-
41
-
42
-
43
-
44
-
45
-
46
-
47
-
48
-
49
-
50
-
51
-
52
-
53
-
54
-
55
-
56
-
57
-
58
-
59
-
60
-
61
-
62
-
63
-
64
-
65
-
66
-
67
-
68
-
69
-
70
-
71
-
72
-
73
-
74
-
75
-
76
-
77
-
78
-
79
-
80
-
81
-
82
-
83
-
84
-
85
-
86
-
87
-
88
-
89
-
90
-
91
-
92
 |
 |
The Procter & Gamble Company 9
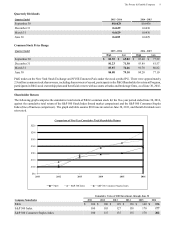
Quarterly Dividends
Quarter Ended 2015 - 2016 2014 - 2015
September 30 $0.6629 $0.6436
December 31 0.6629 0.6436
March 31 0.6629 0.6436
June 30 0.6695 0.6629
Common Stock Price Range
Quarter Ended 2015 - 2016 2014 - 2015
High Low High Low
September 30 $ 82.55 $ 65.02 $ 85.40 $ 77.29
December 31 81.23 71.30 93.89 81.57
March 31 83.87 74.46 91.78 80.82
June 30 84.80 79.10 84.20 77.10
P&G trades on the New York Stock Exchange and NYSE Euronext-Paris under the stock symbol PG. There were approximately
2.9 million common stock shareowners, including shareowners of record, participants in the P&G Shareholder Investment Program,
participants in P&G stock ownership plans and beneficial owners with accounts at banks and brokerage firms, as of June 30, 2016.
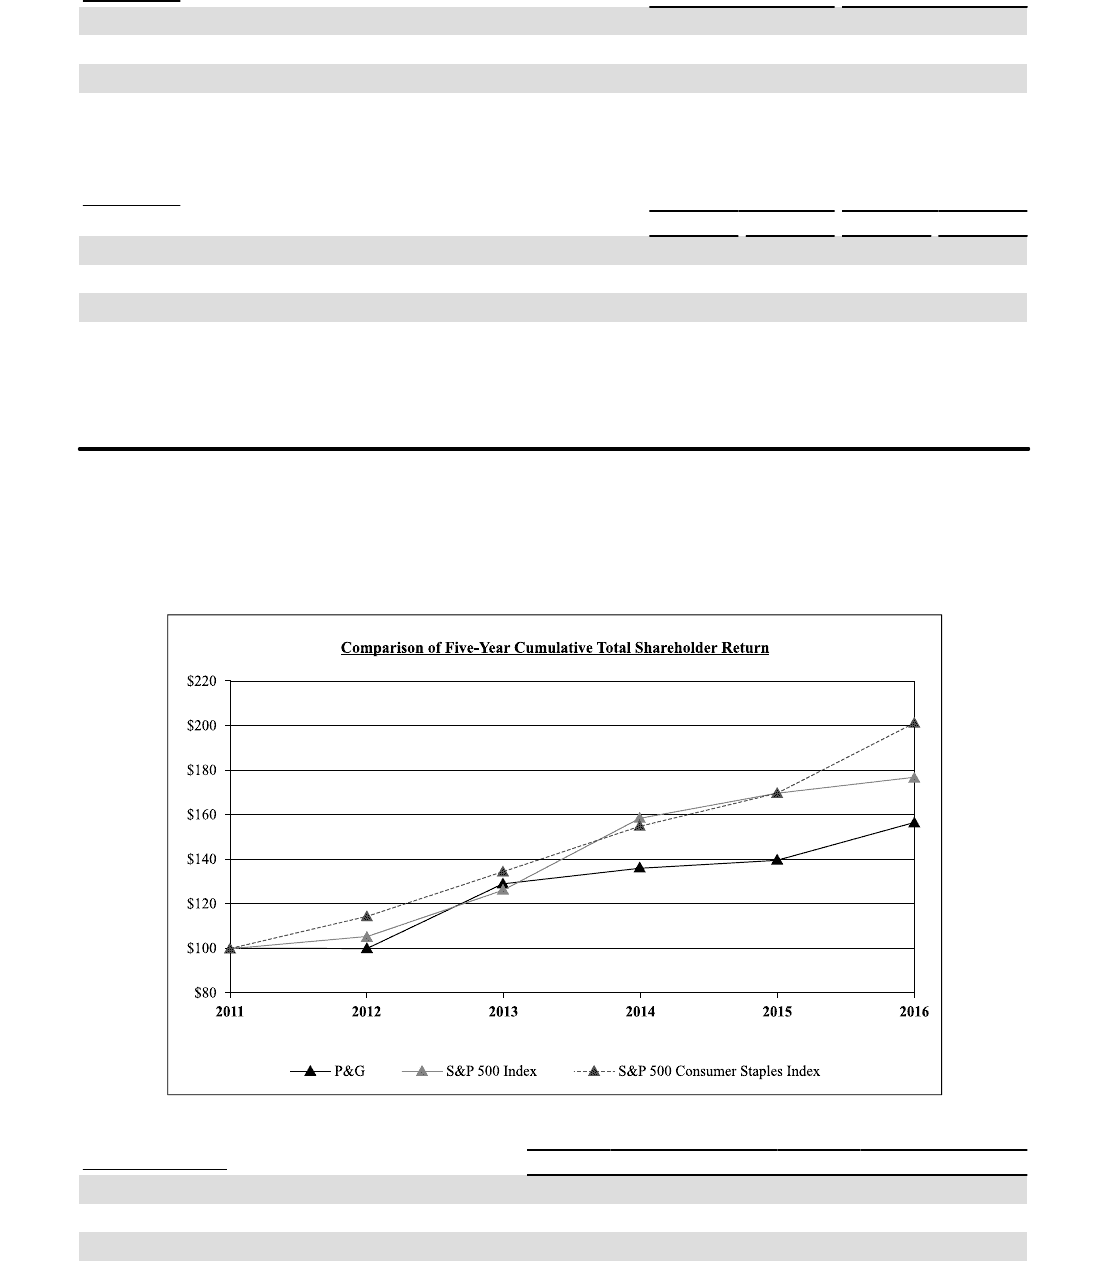
Shareholder Return
The following graph compares the cumulative total return of P&G’s common stock for the five-year period ended June 30, 2016,
against the cumulative total return of the S&P 500 Stock Index (broad market comparison) and the S&P 500 Consumer Staples
Index (line of business comparison). The graph and table assume $100 was invested on June 30, 2011, and that all dividends were
reinvested.
Cumulative Value of $100 Investment, through June 30
Company Name/Index 2011 2012 2013 2014 2015 2016
P&G $ 100 $ 100 $ 129 $ 136 $ 140 $ 156
S&P 500 Index 100 105 127 158 170 177
S&P 500 Consumer Staples Index 100 115 135 155 170 202