Proctor and Gamble 2016 Annual Report Download - page 28
Download and view the complete annual report
Please find page 28 of the 2016 Proctor and Gamble annual report below. You can navigate through the pages in the report by either clicking on the pages listed below, or by using the keyword search tool below to find specific information within the annual report.-
 1
1 -
2
-
3
-
4
-
5
-
6
-
7
-
8
-
9
-
10
-
11
-
12
-
13
-
14
-
15
-
16
-
17
-
 18
18 -
 19
19 -
 20
20 -
 21
21 -
 22
22 -
 23
23 -
 24
24 -
 25
25 -
 26
26 -
 27
27 -
 28
28 -
 29
29 -
 30
30 -
 31
31 -
 32
32 -
 33
33 -
 34
34 -
 35
35 -
 36
36 -
 37
37 -
 38
38 -
39
-
40
-
41
-
42
-
43
-
44
-
45
-
46
-
47
-
48
-
49
-
50
-
51
-
52
-
53
-
54
-
55
-
56
-
57
-
58
-
59
-
60
-
61
-
62
-
63
-
64
-
65
-
66
-
67
-
68
-
69
-
70
-
71
-
72
-
73
-
74
-
75
-
76
-
77
-
78
-
79
-
80
-
81
-
82
-
83
-
84
-
85
-
86
-
87
-
88
-
89
-
90
-
91
-
92
 |
 |

14 The Procter & Gamble Company
categories and brands, purchase them in a store or online and
use them in their homes.
Winning with consumers around the world and against our best
competitors requires innovation. Innovation has always been,
and continues to be, P&G’s lifeblood. Innovation requires
consumer insights and technology advancements that lead to
product improvements, improved marketing and
merchandising programs and game-changing inventions that
create new brands and categories.
Productivity improvement is critical to delivering our balanced
top-line growth, bottom-line growth and value creation
objectives. Productivity improvement and sales growth
reinforce and fuel each other. We are driving productivity
improvement across all elements of cost, including cost of
goods sold, marketing and promotional expenses and non-
manufacturing overhead. Productivity improvements and cost
savings are being reinvested in product and packaging
improvements, brand awareness-building advertising and
trial-building sampling programs, increased sales coverage
and R&D programs.
We are improving operational effectiveness and organizational
culture through enhanced clarity of roles and responsibilities,
accountability and incentive compensation programs.
The Company has undertaken an effort to focus and strengthen
its business portfolio to compete in categories and with brands
that are structurally attractive and that play to P&G's strengths.
The ongoing portfolio of businesses consists of 10 product
categories. These are categories where P&G has leading
market positions, strong brands and consumer-meaningful
product technologies.
We believe these strategies are right for the long-term health
of the Company and our objective of delivering total
shareholder return in the top one-third of our peer group.
The Company expects the delivery of the following long-term
annual financial targets will result in total shareholder returns
in the top third of the competitive peer group:
• Organic sales growth above market growth rates in the
categories and geographies in which we compete;
• Core EPS growth of mid-to-high single digits; and
• Adjusted free cash flow productivity of 90% or greater.
In periods with significant macroeconomic pressures, we
intend to maintain a disciplined approach to investing so as not
to sacrifice the long-term health of our businesses to meet short-
term objectives in any given year.
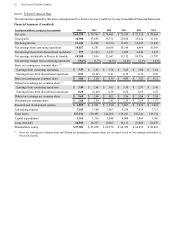
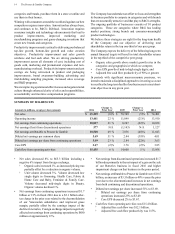
SUMMARY OF 2016 RESULTS
Amounts in millions, except per share amounts 2016
Change vs.
Prior Year 2015
Change vs.
Prior Year 2014
Net sales $ 65,299 (8)% $ 70,749 (5)% $ 74,401
Operating income 13,441 22 % 11,049 (21)% 13,910
Net earnings from continuing operations 10,027 21 % 8,287 (22)% 10,658
Net earnings/(loss) from discontinued operations 577 N/A (1,143) N/A 1,127
Net earnings attributable to Procter & Gamble 10,508 49 % 7,036 (40)% 11,643
Diluted net earnings per common share 3.69 51 % 2.44 (39)% 4.01
Diluted net earnings per share from continuing operations 3.49 23 % 2.84 (22)% 3.63
Core EPS 3.67 (2)% 3.76 (2)% 3.85
Cash flow from operating activities 15,435 6% 14,608 5% 13,958
• Net sales decreased 8% to $65.3 billion including a
negative 6% impact from foreign exchange.
Organic sales increased 1%, as increased pricing was
partially offset by a reduction in organic volume.
Unit volume decreased 3%. Volume decreased low
single digits in Grooming, Health Care, Fabric &
Home Care and Baby, Feminine & Family Care.
Volume decreased mid-single digits in Beauty.
Organic volume declined 1%.
• Net earnings from continuing operations increased $1.7
billion or 21% in fiscal 2016 due to a $2.1 billion after-
tax charge in the prior year related to the deconsolidation
of our Venezuelan subsidiaries and improved gross
margin, partially offset by the earnings impact of the
decline in net sales. Foreign exchange impacts negatively
affected net earnings from continuing operations by $880
million or approximately 11%.
• Net earnings from discontinued operations increased $1.7
billion due primarily to the net impact of a gain on the sale
of our Batteries business in fiscal 2016 and higher
impairment charges on that business in the prior period.
• Net earnings attributable to Procter & Gamble were $10.5
billion, an increase of $3.5 billion or 49% versus the prior
year due to the aforementioned increases in net earnings
from both continuing and discontinued operations.
• Diluted net earnings per share increased 51% to $3.69.
Diluted net earnings per share from continuing
operations increased 23% to $3.49.
Core EPS decreased 2% to $3.67.
• Cash flow from operating activities was $15.4 billion.
Adjusted free cash flow was $12.1 billion.
Adjusted free cash flow productivity was 115%.