Proctor and Gamble 2016 Annual Report Download - page 34
Download and view the complete annual report
Please find page 34 of the 2016 Proctor and Gamble annual report below. You can navigate through the pages in the report by either clicking on the pages listed below, or by using the keyword search tool below to find specific information within the annual report.-
 1
1 -
2
-
3
-
4
-
5
-
6
-
7
-
8
-
9
-
10
-
11
-
12
-
13
-
14
-
15
-
16
-
17
-
18
-
19
-
20
-
21
-
22
-
23
-
 24
24 -
 25
25 -
 26
26 -
 27
27 -
 28
28 -
 29
29 -
 30
30 -
 31
31 -
 32
32 -
 33
33 -
 34
34 -
 35
35 -
 36
36 -
 37
37 -
 38
38 -
 39
39 -
 40
40 -
 41
41 -
 42
42 -
 43
43 -
 44
44 -
45
-
46
-
47
-
48
-
49
-
50
-
51
-
52
-
53
-
54
-
55
-
56
-
57
-
58
-
59
-
60
-
61
-
62
-
63
-
64
-
65
-
66
-
67
-
68
-
69
-
70
-
71
-
72
-
73
-
74
-
75
-
76
-
77
-
78
-
79
-
80
-
81
-
82
-
83
-
84
-
85
-
86
-
87
-
88
-
89
-
90
-
91
-
92
 |
 |

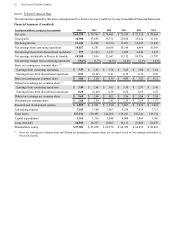
20 The Procter & Gamble Company
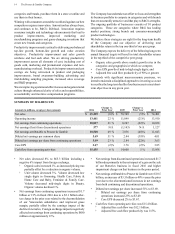
Net earnings decreased 9% to $2.0 billion primarily due to the
reduction in net sales, along with a 10 basis-point decrease in
net earnings margin. Net earnings margin decreased due to an
increase in SG&A as a percentage of net sales, largely offset
by gross margin expansion. Gross margin improved due to
productivity savings, increased pricing and lower commodity
costs, partially offset by negative mix. SG&A as a percentage
of net sales increased as lower marketing and overhead
spending from the Company's focus on efficiencies was more
than offset by the negative scale impacts from the reduction in
sales.
Fiscal year 2015 compared with fiscal year 2014
Beauty net sales decreased 6% to $12.6 billion in 2015 on a
3% decrease in unit volume. Organic sales were unchanged
on a 2% decline in organic volume. Unfavorable foreign
exchange reduced net sales by 5%. Increased pricing was a
benefit of 2%. Global market share of the Beauty segment
decreased 0.6 points. Volume decreased low single digits in
developed markets and was down mid-single digits in
developing markets.
• Volume in Hair Care decreased low single digits in both
developed and developing markets following minor
divestitures and competitive activity. Global market share
of the hair care category was down more than half a point.
• Volume in Skin and Personal Care was down mid-single
digits, driven by a high single-digits decline in developing
markets, primarily due to decreases in skin care and
personal cleansing due to ongoing competitive activity.
Volume was unchanged in developed markets. Global
market share of the skin and personal care category was
down half a point.
Net earnings decreased 5% to $2.2 billion primarily due to
lower volume and the currency-driven reduction in net sales.
Net earnings margin increased 10 basis points primarily due
to a reduction in SG&A as a percent of sales, behind lower
spending from the Company's focus on marketing efficiencies.
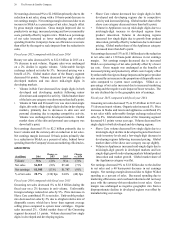
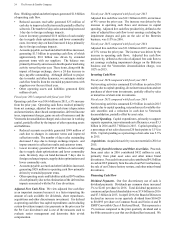
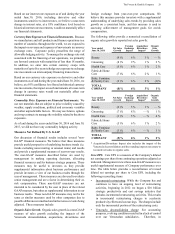
GROOMING
($ millions) 2016
Change vs.
2015 2015
Change
vs. 2014
Volume N/A (2)% N/A (3)%
Net sales $6,815 (8)% $7,441 (7)%
Net earnings $1,548 (13)% $1,787 (9)%
% of net sales 22.7% (130) bps 24.0% (40) bps
Fiscal year 2016 compared with fiscal year 2015
Grooming net sales decreased 8% to $6.8 billion during the
fiscal year on a 2% decrease in unit volume. Unfavorable
foreign exchange reduced net sales by 9%. Price increases in
Shave Care contributed 5% to net sales. Unfavorable product
mix decreased net sales by 2% due to a higher relative mix of
disposable razors, which have lower than segment average
selling prices compared to system razor cartridges. Organic
sales increased 2%. Global market share of the Grooming
segment decreased 1.1 points. Volume decreased low single
digits in developed and developing regions.
• Shave Care volume decreased low single digits in both
developed and developing regions due to competitive
activity and increased pricing. Global market share of the
shave care category decreased more than half a point.
• Volume in Appliances was up mid-single digits due to a
mid-single-digit increase in developed regions from
product innovation. Volume in developing regions
increased low single digits due to growth from product
innovation, partially offset by reductions due to increased
pricing. Global market share of the Appliances category
decreased more than half a point.
Net earnings decreased 13% to $1.5 billion due to the reduction
in net sales and a 130 basis-point decrease in net earnings
margin. Net earnings margin decreased due to increased
SG&A as a percentage of net sales partially offset by a lower
tax rate. Gross margin was unchanged as the benefits of
increased pricing and productivity efforts were largely offset
by unfavorable foreign exchange impacts and negative product
mix caused by an increase in the proportion of disposable razor
sales compared to system razor cartridges. SG&A as a
percentage of net sales increased due to increased marketing
spending and the negative scale impact of lower net sales. The
tax rate declined due to the geographic mix of earnings.
Fiscal year 2015 compared with fiscal year 2014
Grooming net sales decreased 7% to $7.4 billion in 2015 on a
3% decrease in unit volume. Organic sales increased 1%. Price
increases in blades and razors and appliances contributed 4%
to net sales while unfavorable foreign exchange reduced net
sales by 8%. Global market share of the Grooming segment
decreased 0.1 points versus year ago. Volume decreased low
single digits in both developed and developing regions.
• Shave Care volume decreased low single digits due to a
mid-single-digit decline in developed regions from lower
trade inventory levels and a low-single digit decrease in
developing regions following increased pricing. Global
market share of the shave care category was up slightly.
• Volume in Appliances increased mid-single digits due to
mid-single-digit growth in developed markets and low
single-digit growth in developing markets behind product
innovation and market growth. Global market share of
the Appliances category was flat.
Net earnings decreased 9% to $1.8 billion due to the decline
in net sales and a 40 basis-point decrease in net earnings
margin. Net earnings margin decreased due to higher SG&A
spending as a percent of sales. Decreased spending due to
marketing efficiencies and overhead reductions did not keep
pace with the currency-driven reduction in net sales. Gross
margin was unchanged as negative geographic mix from a
disproportionate decline in developed regions was offset by
manufacturing cost savings.