Proctor and Gamble 2016 Annual Report Download - page 38
Download and view the complete annual report
Please find page 38 of the 2016 Proctor and Gamble annual report below. You can navigate through the pages in the report by either clicking on the pages listed below, or by using the keyword search tool below to find specific information within the annual report.-
 1
1 -
2
-
3
-
4
-
5
-
6
-
7
-
8
-
9
-
10
-
11
-
12
-
13
-
14
-
15
-
16
-
17
-
18
-
19
-
20
-
21
-
22
-
23
-
24
-
25
-
26
-
27
-
 28
28 -
 29
29 -
 30
30 -
 31
31 -
 32
32 -
 33
33 -
 34
34 -
 35
35 -
 36
36 -
 37
37 -
 38
38 -
 39
39 -
 40
40 -
 41
41 -
 42
42 -
 43
43 -
 44
44 -
 45
45 -
 46
46 -
 47
47 -
 48
48 -
49
-
50
-
51
-
52
-
53
-
54
-
55
-
56
-
57
-
58
-
59
-
60
-
61
-
62
-
63
-
64
-
65
-
66
-
67
-
68
-
69
-
70
-
71
-
72
-
73
-
74
-
75
-
76
-
77
-
78
-
79
-
80
-
81
-
82
-
83
-
84
-
85
-
86
-
87
-
88
-
89
-
90
-
91
-
92
 |
 |
24 The Procter & Gamble Company
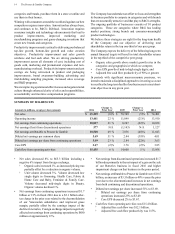
flow. Working capital and other impacts generated $1.8 billion
of operating cash flow.
• Reduced accounts receivable generated $35 million of
cash due to improved collection results partially offset by
sales mix. The number of days sales outstanding increased
1 day due to foreign exchange impacts.
• Lower inventory generated $116 million of cash mainly
due to supply chain optimizations and lower commodity
costs. Inventory days on hand increased 4 days primarily
due to foreign exchange impacts.
• Accounts payable, accrued and other liabilities increased,
generating $1.3 billion in operating cash flow, of which
approximately $0.8 billion was driven by extended
payment terms with our suppliers. The balance was
primarily driven by an increase in fourth quarter marketing
activity versus the prior year. These items, along with the
impact of foreign exchange, drove a 24 day increase in
days payable outstanding. Although difficult to project
due to market and other dynamics, we anticipate similar
cash flow benefits from the extended payment terms with
suppliers over the next fiscal year.
• Other operating assets and liabilities generated $204
million of cash.
Fiscal year 2015 compared with fiscal year 2014
Operating cash flow was $14.6 billion in 2015, a 5% increase
from the prior year. Operating cash flows resulted primarily
from net earnings, adjusted for non-cash items (depreciation
and amortization, share-based compensation, deferred income
taxes, impairment charges, gains on sale of businesses and the
Venezuela deconsolidation charge) and a decrease in working
capital, partially offset by the impact of other operating assets
and liabilities.
• Reduced accounts receivable generated $349 million of
cash due to changes in customer terms and improved
collection results. The number of days sales outstanding
decreased 5 days due to foreign exchange impacts and
improvements in collection results and customer terms.
• Lower inventory generated $313 million of cash mainly
due to supply chain optimizations and lower commodity
costs. Inventory days on hand decreased 7 days due to
foreign exchange impacts, supply chain optimizations and
lower commodity costs.
• Accounts payable, accrued and other liabilities increased,
generating $928 million in operating cash flow primarily
driven by extended payment terms.
• Other operating assets and liabilities utilized $976 million
of cash primarily due to the elimination of the deferred tax
impacts associated with the Pet Care divestiture.
Adjusted Free Cash Flow. We view adjusted free cash flow
as an important measure because it is a factor impacting the
amount of cash available for dividends, share repurchases,
acquisitions and other discretionary investment. It is defined
as operating cash flow less capital expenditures and excluding
certain divestiture impacts (tax payments in the prior year for
the Pet Care divestiture) and is one of the measures used to
evaluate senior management and determine their at-risk
compensation.
Fiscal year 2016 compared with fiscal year 2015
Adjusted free cash flow was $12.1 billion in 2016, an increase
of 4% versus the prior year. The increase was driven by the
increase in operating cash flows and decrease in capital
spending. Adjusted free cash flow productivity, defined as the
ratio of adjusted free cash flow to net earnings excluding the
impairment charges and gain on the sale of the Batteries
business, was 115% in 2016.
Fiscal year 2015 compared with fiscal year 2014
Adjusted free cash flow was $11.6 billion in 2015, an increase
of 15% versus the prior year. The increase was driven by the
increase in operating cash flows. Adjusted free cash flow
productivity, defined as the ratio of adjusted free cash flow to
net earnings excluding impairment charges on the Batteries
business and the Venezuelan deconsolidation charge, was
102% in 2015.
Investing Cash Flow
Fiscal year 2016 compared with fiscal year 2015
Net investing activities consumed $5.6 billion in cash in 2016
mainly due to capital spending, divestiture transactions and net
purchases of short-term investments, partially offset by sales
or maturities of short-term investments.
Fiscal year 2015 compared with fiscal year 2014
Net investing activities consumed $2.9 billion in cash in 2015
mainly due to capital spending, net purchases of available-for-
sale securities and a reduction in cash due to Venezuela
deconsolidation, partially offset by asset sales.
Capital Spending. Capital expenditures, primarily to support
capacity expansion, innovation and cost efficiencies, were $3.3
billion in 2016 and $3.7 billion in 2015. Capital spending as
a percentage of net sales decreased 20 basis points to 5.1% in
2016. Capital spending as a percentage of net sales was 5.3%
in 2015.
Acquisitions. Acquisition activity was not material in 2016 or
2015.
Proceeds from Divestitures and Other Asset Sales. Proceeds
from asset sales in 2016 contributed $432 million in cash,
primarily from plant asset sales and other minor brand
divestitures. Proceeds from asset sales contributed $4.5 billion
in cash in 2015 primarily from the sale of our Pet Care business,
the sale of our Chinese battery venture, and other minor brand
divestitures.
Financing Cash Flow
Dividend Payments. Our first discretionary use of cash is
dividend payments. Dividends per common share increased
3% to $2.66 per share in 2016. Total dividend payments to
common and preferred shareholders were $7.4 billion in 2016
and $7.3 billion in 2015. In April 2016, the Board of Directors
declared an increase in our quarterly dividend from $0.6629
to$0.6695pershareonCommonStockandSeriesAandB
ESOP Convertible Class A Preferred Stock. This represents a
1% increase compared to the prior quarterly dividend and is
the 60th consecutive year that our dividend has increased. We