Proctor and Gamble 2016 Annual Report Download - page 36
Download and view the complete annual report
Please find page 36 of the 2016 Proctor and Gamble annual report below. You can navigate through the pages in the report by either clicking on the pages listed below, or by using the keyword search tool below to find specific information within the annual report.-
 1
1 -
2
-
3
-
4
-
5
-
6
-
7
-
8
-
9
-
10
-
11
-
12
-
13
-
14
-
15
-
16
-
17
-
18
-
19
-
20
-
21
-
22
-
23
-
24
-
25
-
 26
26 -
 27
27 -
 28
28 -
 29
29 -
 30
30 -
 31
31 -
 32
32 -
 33
33 -
 34
34 -
 35
35 -
 36
36 -
 37
37 -
 38
38 -
 39
39 -
 40
40 -
 41
41 -
 42
42 -
 43
43 -
 44
44 -
 45
45 -
 46
46 -
47
-
48
-
49
-
50
-
51
-
52
-
53
-
54
-
55
-
56
-
57
-
58
-
59
-
60
-
61
-
62
-
63
-
64
-
65
-
66
-
67
-
68
-
69
-
70
-
71
-
72
-
73
-
74
-
75
-
76
-
77
-
78
-
79
-
80
-
81
-
82
-
83
-
84
-
85
-
86
-
87
-
88
-
89
-
90
-
91
-
92
 |
 |

22 The Procter & Gamble Company
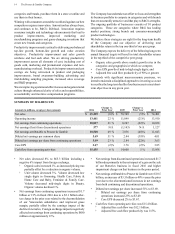
SG&A as a percentage of net sales increased due to an increase
in marketing spending and the negative scale impacts from the
reduction in net sales.
Fiscal year 2015 compared with fiscal year 2014
Fabric & Home Care net sales decreased 5% to $22.3 billion
in 2015 on a 1% increase in unit volume. Organic sales
increased 2%. Unfavorable foreign exchange reduced net sales
by 6%, while pricing added 1% to net sales, mix was neutral,
and minor brand divestitures had a negative impact of about
1%. Global market share of the Fabric & Home Care segment
decreased 0.1 points. Volume increased low single digits in
developed regions and was unchanged in developing regions.
• Fabric Care volume increased low single digits due to low
single-digit growth in developed regions behind market
growth and product innovation. Volume was unchanged
in developing regions. Global market share of the fabric
care category was flat.
• Home Care volume was unchanged as decreases due to
competitive activity, mainly in developed markets, were
offset by increases from product innovation and expanded
distribution. Global market share of the home care
category was down nearly half a point.
Net earnings decreased 5% to $2.6 billion due to the net sales
reduction. Gross margin was unchanged as negative product
mix impacts from investments to expand new innovations
globally were offset by manufacturing cost savings. SG&A as
a percent of net sales was unchanged as lower spending due to
marketing and overhead efficiencies kept pace with reduced
sales.
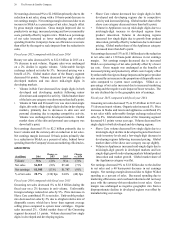
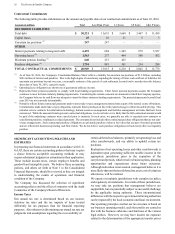
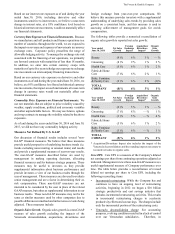
BABY, FEMININE & FAMILY CARE
($ millions) 2016
Change
vs. 2015 2015
Change
vs. 2014
Volume N/A (3)% N/A (1)%
Net sales $18,505 (9)% $20,247 (3)%
Net earnings $2,650 (10)% $2,938 —%
% of net sales 14.3% (20) bps 14.5% 50 bps
Fiscal year 2016 compared with fiscal year 2015
Baby, Feminine & Family Care net sales decreased 9% to $18.5
billion during the fiscal year on a 3% decline in unit volume.
Unfavorable foreign exchange reduced net sales by 6%.
Organic sales declined 1% on a 2% decline in organic volume.
Global market share of the Baby, Feminine & Family Care
segment decreased 1.1 points. Volume increased low single
digits in developed regions and decreased double digits in
developing regions.
• Volume in Baby Care was down mid-single digits due to
a high single-digit decrease in developing regions caused
by price increases in the previous fiscal year, the Venezuela
deconsolidation and competitive activity. Organic volume
in developing markets was down mid-single digits.
Volume was up low single digits in developed regions as
product innovation and market growth more than offset
competitive activity. Global market share of the baby care
category decreased less than two points, primarily
attributable to developing markets.
• Volume in Feminine Care declined low single digits due
to a mid-single-digit decrease in developing regions
caused by competitive activity and price increases in the
previous fiscal year, partially offset by market growth. In
developed regions, volume was unchanged. Global
market share of the feminine care category decreased more
than half a point.
• Volume in Family Care decreased low single digits due to
a double-digit decline in developing regions driven by the
discontinuation of non-strategic products. Volume in
developed regions increased low single digits due to
product innovation and increased merchandising. In the
U.S., all-outlet share of the family care category decreased
nearly half a point.
Net earnings decreased 10% to $2.7 billion primarily due to
the reduction in net sales. Net earnings margin decreased 20
basis points as higher gross margin was more than offset by an
increase in SG&A as a percentage of net sales and a higher tax
rate. Gross margin increased driven by manufacturing cost
savings and lower commodity costs, partially offset by
negative product mix. SG&A as a percentage of net sales
increased due to the negative scale impact from the reduction
in net sales. The higher tax rate versus the prior year was due
to the geographic mix of earnings.
Fiscal year 2015 compared with fiscal year 2014
Baby, Feminine & Family Care net sales were down 3% to
$20.2 billion in 2015 on a 1% decline in unit volume. Organic
sales were up 3%. Price increases, primarily in Baby Care,
increased net sales by 2%. Favorable geographic mix from
higher developed market volume in both Feminine Care and
Baby Care and from product mix in Feminine Care increased
net sales by 2%. Unfavorable foreign exchange reduced net
sales by 6%. Global market share of the Baby, Feminine &
Family Care segment decreased 0.6 points. Volume increased
low single digits in developed regions and decreased high
single digits in developing regions.
• Volume in Baby Care decreased low single digits due to
a mid-single-digit decrease in developing regions
following increased pricing, partially offset by a low
single-digit increase in developed regions from product
innovation. Global market share of the baby care category
decreased less than a point.
• Volume in Feminine Care decreased low single digits as
high single-digit decline in developing regions due to
competition and increased pricing was partially offset by
a mid-single-digit increase in developed regions from
product innovation, including the entry into the female
adult incontinence category. Global market share of the
feminine care category was flat.
• Volume in Family Care was unchanged as low single-digit
growth in developed regions was offset by a double-digit
decline in developing regions due to discontinuation of
lower priced product offerings. In the U.S., all-outlet share
of the family care category decreased less than a point.