Proctor and Gamble 2016 Annual Report Download - page 56
Download and view the complete annual report
Please find page 56 of the 2016 Proctor and Gamble annual report below. You can navigate through the pages in the report by either clicking on the pages listed below, or by using the keyword search tool below to find specific information within the annual report.-
 1
1 -
2
-
3
-
4
-
5
-
6
-
7
-
8
-
9
-
10
-
11
-
12
-
13
-
14
-
15
-
16
-
17
-
18
-
19
-
20
-
21
-
22
-
23
-
24
-
25
-
26
-
27
-
28
-
29
-
30
-
31
-
32
-
33
-
34
-
35
-
36
-
37
-
38
-
39
-
40
-
41
-
42
-
43
-
44
-
45
-
 46
46 -
 47
47 -
 48
48 -
 49
49 -
 50
50 -
 51
51 -
 52
52 -
 53
53 -
 54
54 -
 55
55 -
 56
56 -
 57
57 -
 58
58 -
 59
59 -
 60
60 -
 61
61 -
 62
62 -
 63
63 -
 64
64 -
 65
65 -
 66
66 -
67
-
68
-
69
-
70
-
71
-
72
-
73
-
74
-
75
-
76
-
77
-
78
-
79
-
80
-
81
-
82
-
83
-
84
-
85
-
86
-
87
-
88
-
89
-
90
-
91
-
92
 |
 |

42 The Procter & Gamble Company
Amounts in millions of dollars except per share amounts or as otherwise specified.
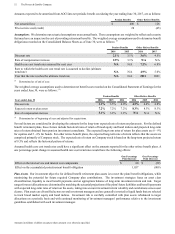
Our business units are comprised of similar product categories.
Nine business units individually accounted for 5% or more of
consolidated net sales as follows:
% of Sales by Business Unit*
Years ended June 30 2016 2015 2014
Fabric Care 22% 22% 22%
Baby Care 14% 15% 15%
Hair Care 10% 11% 11%
Home Care 10% 9% 9%
Shave Care 9% 9% 10%
Family Care 8% 8% 7%
Oral Care 8% 8% 7%
Skin and Personal Care 8% 7% 7%
Feminine Care 6% 6% 6%
All Other 5% 5% 6%
TOTAL 100% 100% 100%
* % of sales by business unit excludes sales held in Corporate.
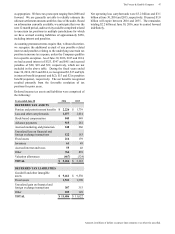
The Company had net sales in the U.S. of $27.0 billion, $26.8
billion and $26.7 billion for the years ended June 30, 2016,
2015 and 2014, respectively. Long-lived assets in the U.S.
totaled $8.5 billion and $8.3 billion as of June 30, 2016 and
2015, respectively. Long-lived assets consists of property,
plant and equipment. No other country's net sales or long-lived
assets exceed 10% of the Company totals.
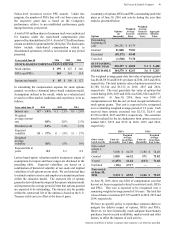
Our largest customer, Wal-Mart Stores, Inc. and its affiliates,
accounted for approximately 15% of consolidated net sales in
2016, 2015 and 2014. No other customer represents more than
10% of our consolidated net sales.
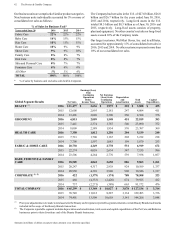
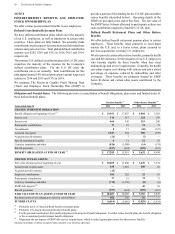
Global Segment Results
Net Sales
Earnings/(Loss)
from
Continuing
Operations
Before
Income Taxes
Net Earnings
/(Loss) from
Continuing
Operations
Depreciation
and
Amortization
Total
Assets
Capital
Expenditures
BEAUTY
(1)
2016 $ 11,477 $ 2,636 $ 1,975 $ 218 $ 3,888 $ 435
2015 12,608 2,895 2,181 247 4,004 411
2014 13,401 3,020 2,300 256 4,564 376
GROOMING 2016 6,815 2,009 1,548 451 22,819 383
2015 7,441 2,374 1,787 540 23,090 372
2014 8,009 2,589 1,954 576 23,767 369
HEALTH CARE 2016 7,350 1,812 1,250 204 5,139 240
2015 7,713 1,700 1,167 202 5,212 218
2014 7,798 1,597 1,083 199 5,879 253
FABRIC & HOME CARE 2016 20,730 4,249 2,778 531 6,919 672
2015 22,274 4,059 2,634 547 7,155 986
2014 23,506 4,264 2,770 539 7,938 1,057
BABY, FEMININE & FAMILY
CARE 2016 18,505 4,042 2,650 886 9,863 1,261
2015 20,247 4,317 2,938 924 10,109 1,337
2014 20,950 4,310 2,940 908 10,946 1,317
CORPORATE
(1) (2)
2016 422 (1,379)(174) 788 78,508 323
2015 466 (4,333)(2,420) 674 79,925 412
2014 737 (2,271)(389) 663 91,172 476
TOTAL COMPANY 2016 $ 65,299 $ 13,369 $ 10,027 $ 3,078 $ 127,136 $ 3,314
2015 70,749 11,012 8,287 3,134 129,495 3,736
2014 74,401 13,509 10,658 3,141 144,266 3,848
(1)
Prior year adjustments were made to total assets for the Beauty and Corporate reportable segments related to certain Beauty Brands trademarks
included in the scope of the Beauty Brands transaction.
(2)
The Corporate reportable segment includes depreciation and amortization, total assets and capital expenditures of the Pet Care and Batteries
businesses prior to their divestiture and of the Beauty Brands businesses.