Proctor and Gamble 2016 Annual Report Download - page 77
Download and view the complete annual report
Please find page 77 of the 2016 Proctor and Gamble annual report below. You can navigate through the pages in the report by either clicking on the pages listed below, or by using the keyword search tool below to find specific information within the annual report.-
 1
1 -
2
-
3
-
4
-
5
-
6
-
7
-
8
-
9
-
10
-
11
-
12
-
13
-
14
-
15
-
16
-
17
-
18
-
19
-
20
-
21
-
22
-
23
-
24
-
25
-
26
-
27
-
28
-
29
-
30
-
31
-
32
-
33
-
34
-
35
-
36
-
37
-
38
-
39
-
40
-
41
-
42
-
43
-
44
-
45
-
46
-
47
-
48
-
49
-
50
-
51
-
52
-
53
-
54
-
55
-
56
-
57
-
58
-
59
-
60
-
61
-
62
-
63
-
64
-
65
-
66
-
 67
67 -
 68
68 -
 69
69 -
 70
70 -
 71
71 -
 72
72 -
 73
73 -
 74
74 -
 75
75 -
 76
76 -
 77
77 -
 78
78 -
 79
79 -
 80
80 -
 81
81 -
 82
82 -
 83
83 -
 84
84 -
 85
85 -
 86
86 -
 87
87 -
88
-
89
-
90
-
91
-
92
 |
 |

The Procter & Gamble Company 63
Amounts in millions of dollars except per share amounts or as otherwise specified.
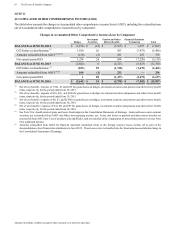
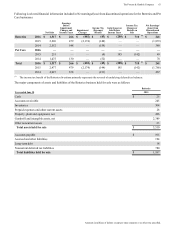
Following is selected financial information included in Net earnings/(loss) from discontinued operations for the Batteries and Pet
Care businesses:
Net Sales
Earnings
Before
Impairment
Charges and
Income Taxes
Impairment
Charges
Income Tax
(Expense)/
Benefit
Gain/(Loss) on
Sale Before
Income Taxes
Income Tax
(Expense)/
Benefit on
Sale
Net Earnings/
(Loss) from
Discontinued
Operations
Batteries 2016 $ 1,517 $ 266 $ (402)$ (45)$ (288) $ 710
(1)
$ 241
2015 2,226 479 (2,174)(140)— —
(1,835)
2014 2,552 548 — (159) — — 389
Pet Care 2016 — — — — — — —
2015 251 — — (4) 195 (142)49
2014 1,475 130 — (52)— — 78
Total 2016 $ 1,517 $ 266 $ (402)$ (45)$ (288) $ 710
(1)
$ 241
2015 2,477 479 (2,174)(144) 195 (142)(1,786)
2014 4,027 678 — (211) — — 467
(1)
The income tax benefit of the Batteries divestiture primarily represents the reversal of underlying deferred tax balances.
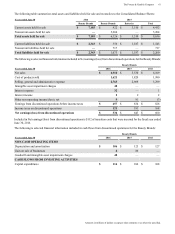
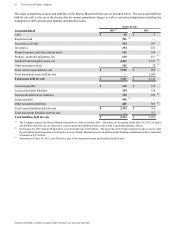
The major components of assets and liabilities of the Batteries business held for sale were as follows:
Batteries
Year ended June 30 2015
Cash $ 25
Accounts receivable 245
Inventories 304
Prepaid expenses and other current assets 28
Property, plant and equipment, net 496
Goodwill and intangible assets, net 2,389
Other noncurrent assets 23
Total assets held for sale $ 3,510
Accounts payable $ 195
Accrued and other liabilities 194
Long-term debt 18
Noncurrent deferred tax liabilities 780
Total liabilities held for sale $ 1,187