Proctor and Gamble 2016 Annual Report Download - page 30
Download and view the complete annual report
Please find page 30 of the 2016 Proctor and Gamble annual report below. You can navigate through the pages in the report by either clicking on the pages listed below, or by using the keyword search tool below to find specific information within the annual report.-
 1
1 -
2
-
3
-
4
-
5
-
6
-
7
-
8
-
9
-
10
-
11
-
12
-
13
-
14
-
15
-
16
-
17
-
18
-
19
-
 20
20 -
 21
21 -
 22
22 -
 23
23 -
 24
24 -
 25
25 -
 26
26 -
 27
27 -
 28
28 -
 29
29 -
 30
30 -
 31
31 -
 32
32 -
 33
33 -
 34
34 -
 35
35 -
 36
36 -
 37
37 -
 38
38 -
 39
39 -
 40
40 -
41
-
42
-
43
-
44
-
45
-
46
-
47
-
48
-
49
-
50
-
51
-
52
-
53
-
54
-
55
-
56
-
57
-
58
-
59
-
60
-
61
-
62
-
63
-
64
-
65
-
66
-
67
-
68
-
69
-
70
-
71
-
72
-
73
-
74
-
75
-
76
-
77
-
78
-
79
-
80
-
81
-
82
-
83
-
84
-
85
-
86
-
87
-
88
-
89
-
90
-
91
-
92
 |
 |

16 The Procter & Gamble Company
The Company is in the midst of a productivity and cost savings
plan to reduce costs in the areas of supply chain, marketing
and overhead expenses. The plan is designed to accelerate cost
reductions by streamlining management decision making,
manufacturing and other work processes to fund the
Company's growth strategy.
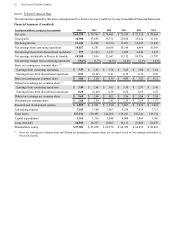
Net Sales
Fiscal year 2016 compared with fiscal year 2015
Net sales decreased 8% to $65.3 billion in 2016 on a 3%
decrease in unit volume versus the prior year period. Volume
decreased low single digits in Grooming, Health Care, Fabric
& Home Care and Baby, Feminine & Family Care and
decreased mid-single digits in Beauty. Volume increased low
single digits in developed regions and declined high single
digits in developing regions, in part due to increased pricing
to address foreign exchange devaluations and due to the
Venezuela deconsolidation and minor brand divestitures.
Organic volume declined mid-single digits in developing
markets. Unfavorable foreign exchange reduced net sales by
6%, while higher pricing drove a 1% favorable impact on net
sales. Organic volume decreased 1% and organic sales grew
1% driven by higher pricing.
Fiscal year 2015 compared with fiscal year 2014
Net sales decreased 5% to $70.7 billion in 2015 on a 1%
decrease in unit volume versus the prior year period. Volume
grew low single digits in Fabric & Home Care. Volume
decreased low single digits in Baby, Feminine & Family Care,
Grooming, Health Care and Beauty. Volume increased low
single digits in developed regions and declined low single
digits in developing regions due, in part, to increased pricing
to address foreign exchange devaluations. Unfavorable
foreign exchange reduced net sales by 6%, while higher pricing
drove a 2% favorable impact on net sales. Favorable product
mix impact of 1% was offset by acquisition and divestiture
activity. Organic volume decreased 1% and organic sales grew
2% driven by higher pricing.
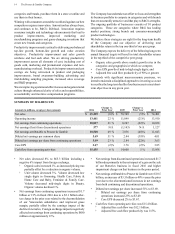
Operating Costs
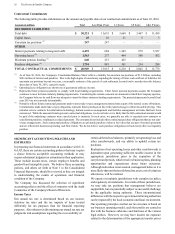
Comparisons as a percentage of net sales; Years ended June 30 2016
Basis Point
Change 2015
Basis Point
Change 2014
Gross margin 49.6% 200 47.6% 10 47.5%
Selling, general and administrative expense 29.0% (10) 29.1% 30 28.8%
Operating margin 20.6% 500 15.6% (310) 18.7%
Earnings from continuing operations before income taxes 20.5% 490 15.6% (260) 18.2%
Net earnings from continuing operations 15.4% 370 11.7% (260) 14.3%
Net earnings attributable to Procter & Gamble 16.1% 620 9.9% (570) 15.6%
Fiscal year 2016 compared with fiscal year 2015
Gross margin increased 200 basis points to 49.6% of net sales
in 2016. Gross margin increased primarily due to:
• a 210 basis point positive impact from manufacturing cost
savings,
• a 110 basis point benefit from lower commodity costs and
• a 70 basis point benefit of higher pricing.
These impacts were partially offset by:
• a 70 basis point negative impact from unfavorable foreign
exchange,
• a 70 basis point decrease due to unfavorable product mix
caused by the disproportionate decline of higher margin
segments like Beauty and by product form mix within the
segments,
• a 20 basis point decrease from negative scale impacts due
to lower volume and
• a 20 basis point decline due to incremental restructuring
activity.
Total SG&A decreased 8% to $18.9 billion primarily due to
reduced overhead spending and a decrease in foreign exchange
transaction charges. SG&A as a percentage of net sales
declined 10 basis points to 29.0%, as the negative scale
impacts of lower net sales and inflationary impacts were more
than offset by cost savings efforts, mainly in overhead
spending, and lower foreign exchange transactional charges.
• Marketing spending as a percentage of net sales increased
90 basis points due to the negative scale impacts from
reduced sales.
• Overhead costs as a percentage of net sales decreased 20
basis points, as 90 basis points of productivity savings
were partially offset by wage inflation, increased sales
personnel in certain businesses, investments in research
and development and the negative scale impacts from
reduced sales.
• Lower foreign exchange transactional charges reduced
SG&A as a percentage of net sales by approximately 70
basis points. A pre-deconsolidation balance sheet
remeasurement charge in Venezuela in the base period
drove 20 basis points of this decline. The balance of the
reduction relates to lower transactional charges from
revaluing receivables and payables from transactions
denominated in a currency other than a local entity’s
functional currency.