Proctor and Gamble 2016 Annual Report Download - page 52
Download and view the complete annual report
Please find page 52 of the 2016 Proctor and Gamble annual report below. You can navigate through the pages in the report by either clicking on the pages listed below, or by using the keyword search tool below to find specific information within the annual report.-
 1
1 -
2
-
3
-
4
-
5
-
6
-
7
-
8
-
9
-
10
-
11
-
12
-
13
-
14
-
15
-
16
-
17
-
18
-
19
-
20
-
21
-
22
-
23
-
24
-
25
-
26
-
27
-
28
-
29
-
30
-
31
-
32
-
33
-
34
-
35
-
36
-
37
-
38
-
39
-
40
-
41
-
 42
42 -
 43
43 -
 44
44 -
 45
45 -
 46
46 -
 47
47 -
 48
48 -
 49
49 -
 50
50 -
 51
51 -
 52
52 -
 53
53 -
 54
54 -
 55
55 -
 56
56 -
 57
57 -
 58
58 -
 59
59 -
 60
60 -
 61
61 -
 62
62 -
63
-
64
-
65
-
66
-
67
-
68
-
69
-
70
-
71
-
72
-
73
-
74
-
75
-
76
-
77
-
78
-
79
-
80
-
81
-
82
-
83
-
84
-
85
-
86
-
87
-
88
-
89
-
90
-
91
-
92
 |
 |

38 The Procter & Gamble Company
See accompanying Notes to Consolidated Financial Statements.
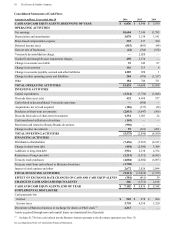
Consolidated Statements of Cash Flows
Amounts in millions; Years ended June 30 2016 2015 2014
CASH AND CASH EQUIVALENTS, BEGINNING OF YEAR $ 6,836 $ 8,548 $ 5,930
OPERATING ACTIVITIES
Net earnings 10,604 7,144 11,785
Depreciation and amortization 3,078 3,134 3,141
Share-based compensation expense 335 337 360
Deferred income taxes (815)(803)(44)
Gain on sale of businesses (41)(766)(154)
Venezuela deconsolidation charge —2,028 —
Goodwill and intangible asset impairment charges 450 2,174 —
Change in accounts receivable 35 349 87
Change in inventories 116 313 8
Change in accounts payable, accrued and other liabilities 1,285 928 1
Change in other operating assets and liabilities 204 (976)(1,557)
Other 184 746 331
TOTAL OPERATING ACTIVITIES 15,435 14,608 13,958
INVESTING ACTIVITIES
Capital expenditures (3,314)(3,736)(3,848)
Proceeds from asset sales 432 4,498 577
Cash related to deconsolidated Venezuela operations —(908)—
Acquisitions, net of cash acquired (186)(137)(24)
Purchases of short-term investments (2,815)(3,647)(568)
Proceeds from sales of short-term investments 1,354 1,203 24
Cash transferred in Batteries divestiture (143)——
Restricted cash related to Beauty Brands divestiture (996)——
Change in other investments 93 (163)(261)
TOTAL INVESTING ACTIVITIES (5,575)(2,890)(4,100)
FINANCING ACTIVITIES
Dividends to shareholders (7,436)(7,287)(6,911)
Change in short-term debt (418)(2,580) 3,304
Additions to long-term debt 3,916 2,138 4,334
Reductions of long-term debt (2,213)(3,512)(4,095)
Treasury stock purchases (4,004)(4,604)(6,005)
Treasury stock from cash infused in Batteries divestiture (1,730)——
Impact of stock options and other 2,672 2,826 2,094
TOTAL FINANCING ACTIVITIES (9,213)(13,019)(7,279)
EFFECT OF EXCHANGE RATE CHANGES ON CASH AND CASH EQUIVALENTS
(381)(411)39
CHANGE IN CASH AND CASH EQUIVALENTS 266 (1,712) 2,618
CASH AND CASH EQUIVALENTS, END OF YEAR $ 7,102 $ 6,836 $ 8,548
SUPPLEMENTAL DISCLOSURE
Cash payments for:
Interest $ 569 $ 678 $ 686
Income taxes 3,730 4,558 3,320
Divestiture of Batteries business in exchange for shares of P&G stock
(1)
4,213 ——
Assets acquired through non-cash capital leases are immaterial for all periods.
(1)
Includes $1,730 from cash infused into the Batteries business pursuant to the divestiture agreement (see Note 13).