Proctor and Gamble 2016 Annual Report Download - page 50
Download and view the complete annual report
Please find page 50 of the 2016 Proctor and Gamble annual report below. You can navigate through the pages in the report by either clicking on the pages listed below, or by using the keyword search tool below to find specific information within the annual report.-
 1
1 -
2
-
3
-
4
-
5
-
6
-
7
-
8
-
9
-
10
-
11
-
12
-
13
-
14
-
15
-
16
-
17
-
18
-
19
-
20
-
21
-
22
-
23
-
24
-
25
-
26
-
27
-
28
-
29
-
30
-
31
-
32
-
33
-
34
-
35
-
36
-
37
-
38
-
39
-
 40
40 -
 41
41 -
 42
42 -
 43
43 -
 44
44 -
 45
45 -
 46
46 -
 47
47 -
 48
48 -
 49
49 -
 50
50 -
 51
51 -
 52
52 -
 53
53 -
 54
54 -
 55
55 -
 56
56 -
 57
57 -
 58
58 -
 59
59 -
 60
60 -
61
-
62
-
63
-
64
-
65
-
66
-
67
-
68
-
69
-
70
-
71
-
72
-
73
-
74
-
75
-
76
-
77
-
78
-
79
-
80
-
81
-
82
-
83
-
84
-
85
-
86
-
87
-
88
-
89
-
90
-
91
-
92
 |
 |

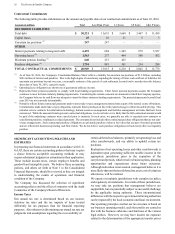
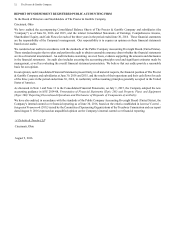
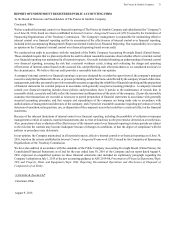
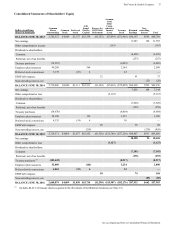
36 The Procter & Gamble Company
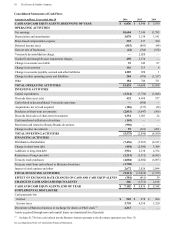
See accompanying Notes to Consolidated Financial Statements.
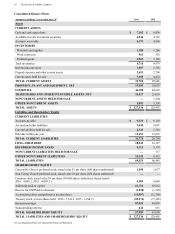
Consolidated Balance Sheets
Amounts in millions; Years ended June 30 2016 2015
Assets
CURRENT ASSETS
Cash and cash equivalents $ 7,102 $ 6,836
Available-for-sale investment securities 6,246 4,767
Accounts receivable 4,373 4,568
INVENTORIES
Materials and supplies 1,188 1,266
Work in process 563 525
Finished goods 2,965 3,188
Total inventories 4,716 4,979
Deferred income taxes 1,507 1,356
Prepaid expenses and other current assets 2,653 2,708
Current assets held for sale 7,185 4,432
TOTAL CURRENT ASSETS 33,782 29,646
PROPERTY, PLANT AND EQUIPMENT, NET 19,385 19,655
GOODWILL 44,350 44,622
TRADEMARKS AND OTHER INTANGIBLE ASSETS, NET 24,527 25,010
NONCURRENT ASSETS HELD FOR SALE — 5,204
OTHER NONCURRENT ASSETS 5,092 5,358
TOTAL ASSETS $ 127,136 $ 129,495
Liabilities and Shareholders' Equity
CURRENT LIABILITIES
Accounts payable $ 9,325 $ 8,138
Accrued and other liabilities 7,449 8,091
Current liabilities held for sale 2,343 1,543
Debt due within one year 11,653 12,018
TOTAL CURRENT LIABILITIES 30,770 29,790
LONG-TERM DEBT 18,945 18,327
DEFERRED INCOME TAXES 9,113 9,179
NONCURRENT LIABILITIES HELD FOR SALE — 717
OTHER NONCURRENT LIABILITIES 10,325 8,432
TOTAL LIABILITIES 69,153 66,445
SHAREHOLDERS' EQUITY
Convertible Class A preferred stock, stated value $1 per share (600 shares authorized) 1,038 1,077
Non-Voting Class B preferred stock, stated value $1 per share (200 shares authorized) ——
Common stock, stated value $1 per share (10,000 shares authorized; shares issued:
2016 - 4,009.2, 2015 - 4,009.2 ) 4,009 4,009
Additional paid-in capital 63,714 63,852
Reserve for ESOP debt retirement (1,290)(1,320)
Accumulated other comprehensive income/(loss) (15,907)(12,780)
Treasury stock, at cost (shares held: 2016 - 1,341.2, 2015 - 1,294.7) (82,176)(77,226)
Retained earnings 87,953 84,807
Noncontrolling interest 642 631
TOTAL SHAREHOLDERS' EQUITY 57,983 63,050
TOTAL LIABILITIES AND SHAREHOLDERS' EQUITY $ 127,136 $ 129,495